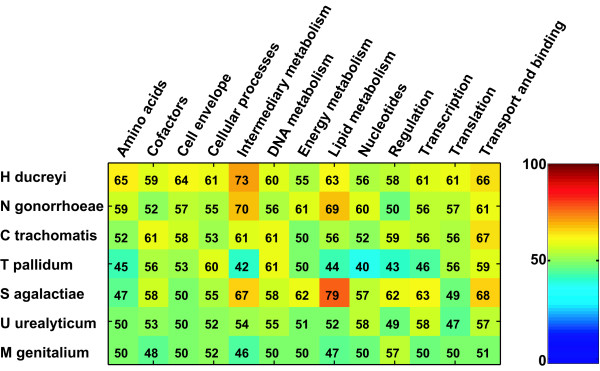
Figure 1.

Function prediction classifier performance. Performance for seven human pathogens and thirteen functional classes is shown as % AUC, and values larger than 50 indicate a better than random classifier. One can see that in four of the seven species prediction results are significantly better than random across all classes. Only on three small genomes (T. pallidum, U. urealyticum and M. genitalium) performance is much weaker. Specific classes (co-factor metabolism, cellular processes, DNA metabolism) show particularly good performance. The functional class that is most easily distinguished from the others contains 'transport and binding proteins' – this good performance is probably due to the characteristic hydrophobic motifs in the transmembrane and binding regions of these proteins. Colors indicate the AUC values, ranging from 0 (dark blue) to 100% (dark red). The same color scale is used for all figures in this paper.
