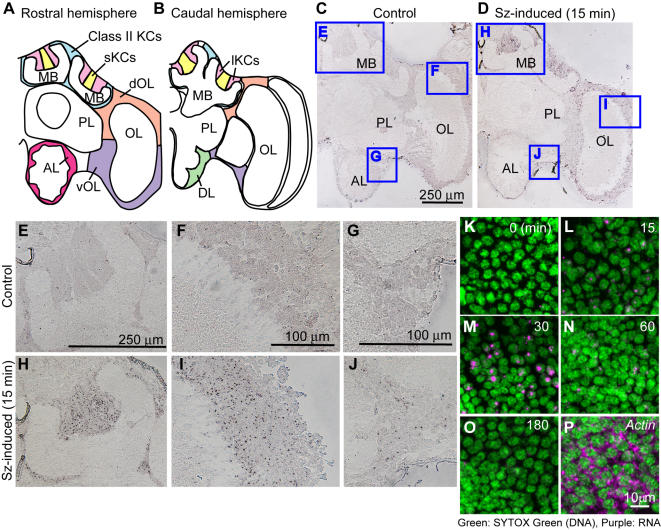
Figure 2.
Kakusei can be used as a marker to visualize neural activity in the honeybee brain. (A and B) Schematic drawings of the rostral (A) and caudal (B) brain hemisphere of worker honeybees. Positions of neuron somata are shown in color. (C–J) Expression of kakusei was detected by in situ hybridization using coronal brain sections of control (C, E–G) or seizure-induced (Sz-induced) (D, H–J) bees. Areas corresponding to panels (E–J) are boxed in (C) and (D). (K–O) Subcellular localization of kakusei was investigated by fluorescent in situ hybridization. Nuclei were visualized by SYTOX Green, which stains DNA. Numbers of each picture indicate time after seizure. Actin mRNA was detected as a control that is translated into protein in the cytoplasm (P). AL, antennal lobe; Class II KCs, class II Kenyon cells; DL, dorsal lobe; dOL, dorsal OL; lKCs, large-type Kenyon cells; MB, mushroom body; OL, optic lobe; PL, protocerebral lobe; sKCs, small-type Kenyon cells; vOL, ventral OL.

