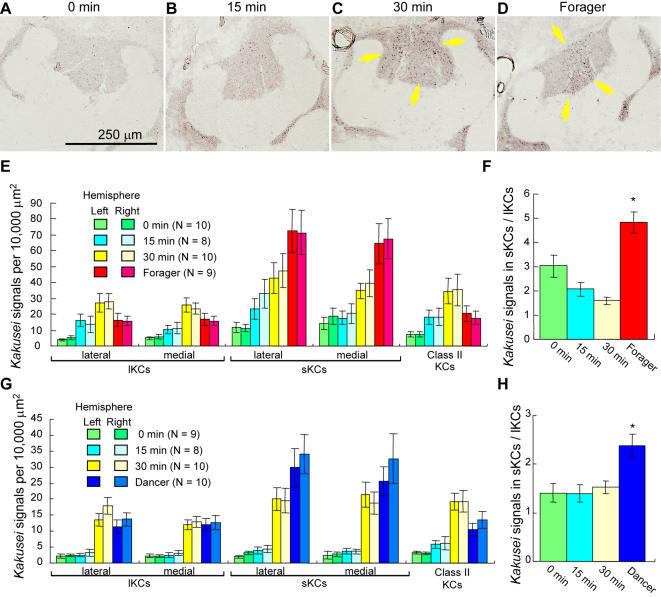
Figure 6.
Re-orienting bees and foragers showed different kakusei expression patterns. (A–D) Representative in situ hybridization pictures of kakusei expression in re-orienting bees and foragers. Arrows indicate the kakusei-positive neurons. Note that kakusei expression pattern is different between the re-orienting bees and foragers. (E) Quantification of kakusei expression in the brains of re-orienting bees and foragers. (F) Ratio of kakusei density in the sKCs to lKCs. (G) Quantitative data of kakusei expression in re-orienting bees and dancers caught from transparent observation hives. Note the different kakusei expression pattern between re-orienting bees and dancers. (H) Ratio of kakusei density in the sKCs to lKCs. Asterisk indicates significant difference between foragers/dancers and the other groups (*, P<0.01; Tukey-Kramer's test after ANOVA).

