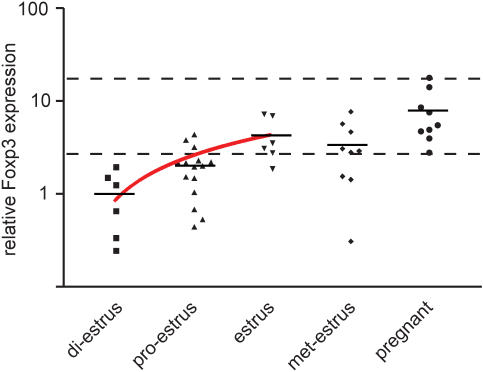
Figure 1. Variation of Foxp3 expression in the uterus during the mouse estrus cycle and pregnancy.
Relative levels of Foxp3 were determined by quantitative RT-PCR performed on total uterine mRNA. Uteri were isolated from non-pregnant or pregnant mice at E10.5 (mid-gestation). The estrus cycle phase of non-pregnant mice was determined by vaginal smear and mice were categorised into 4 groups, according to their estrus cycle phase. Foxp3 levels for the 4 phases are shown in chronological order and compared to the levels in pregnant mice. Each point corresponds to one animal. Horizontal bars represent the mean of each data set. Dotted lines indicate the maximal and minimal values detected for pregnant mice. The red line indicates the linear trend (linear regression, displayed on logarithmic scale) for the phases approaching estrus. The experiment was performed on 37 non-pregnant and 10 pregnant mice. HPRT mRNA expression levels were used for normalisation. PCR assays were performed in triplicate.

