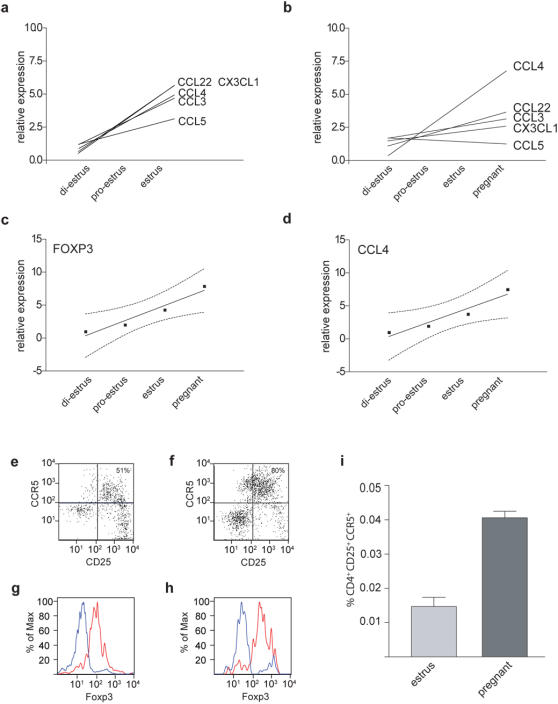
Figure 3. Chemokine fluctuation approaching estrus and pregnancy.
Linear trends for the fluctuation of chemokine expression levels (same sample set used in Figs. 1 and 2) during (a) the phases approaching estrus (diestrus>pro-estrus>estrus) and (b) the phases approaching estrus and pregnancy. (c,d): Linear trends for the fluctuation of (c) Foxp3 and (d) CCL4 expression levels during the phases approaching estrus and pregnancy. Dots represent the mean of each data set. Dotted curves represent the 95% confidence interval of the trend line. (e–i) CCR5+regulatory T cells in the uterus of mice at estrus or at mid-gestation. n = 3 for estrus, each sample pooled from 3 mice; n = 5 for pregnant, one mouse per sample. Uterine cells were isolated from C57BL/6 mice (e,g) at estrus or (f,h) at E10.5 (mid-gestation) after allogeneic mating and analyzed by FACS for the expression of (e,f) CD4, CD25 and CCR5 or (g,h) CD4, CD25 and Foxp3. (e,f) Plots show CD25 and CCR5 surface expression for all CD4+gated cells. Number in top right corner denotes the percentage of CCR5+cells amongst CD4+CD25+cells. 1×10⁶ ‘total’ uterine cells collected; all CD4+cells shown. (g,h) Histograms show intracellular Foxp3 stain in (red) CD4+CD25+or (blue) CD4+CD25− cells. Representative samples are shown. (i) Uterine cells from C57BL/6 mice at estrus or at E10.5 of allogeneic pregnancy were analyzed by FACS. The percentage of CD4+CD25+CCR5+cells amongst all uterine cells is shown.

