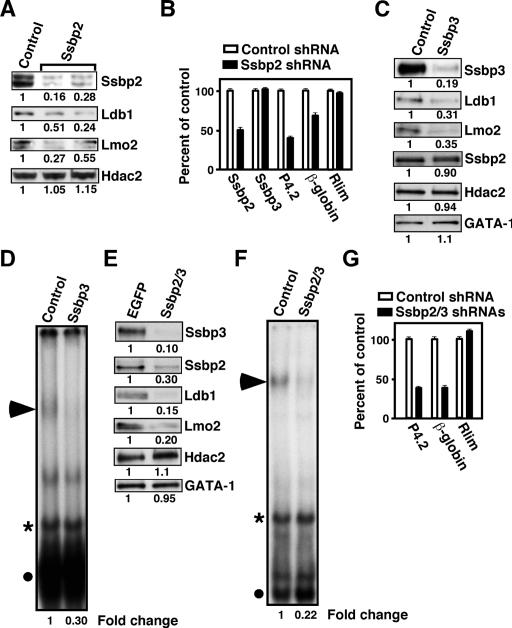
Figure 5.
Depletion of Ssbp2 and Ssbp3 reduces Ldb1 and Lmo2 abundance and E-box-GATA DNA-binding activity. (A) Western blot analysis of Ssbp2, Ldb1, Lmo2, and Hdac2 expression in whole cellular extracts from Ssbp2 shRNA-transduced MEL cells treated with 1.5% DMSO for 2 d. The levels of proteins in cells expressing Ssbp2 shRNA relative to those expressing a control shRNA are shown below the autoradiographs. (B) Quantitative RT–PCR analysis of Ssbp2, Ssbp3, P4.2, β-globin, and Rlim mRNAs in differentiating MEL cells transiently transfected with expression plasmid for Ssbp2 shRNA or control shRNA. (C) Western blot analysis of Ssbp3, Ldb1, Lmo2, Ssbp2, Hdac2, and GATA-1 expression in nuclear extracts from short-term puromycin-selected MEL cells transfected with expression plasmid for Ssbp3 shRNA or control shRNA. (D) EMSA of nuclear extracts prepared as above. The E-box-GATA DNA-binding complex is marked with a solid arrowhead. Its abundance was normalized to that of a nonspecific protein–DNA complex (asterisk). The fold change in E-box-GATA DNA-binding activity in cells expressing Ssbp3 shRNA relative to those expressing control shRNA is shown below the autoradiographs. (E) Western blot analysis of Ssbp3, Ssbp2, Ldb1, Lmo2, Hdac2, and GATA-1 abundance in nuclear extracts from short-term puromycin-selected MEL cells expressing shRNAs to both Ssbp2 and Ssbp3 or control (EGFP) shRNA. (F) EMSA of nuclear extracts prepared as above. Protein–DNA complexes are marked as in D. (G) Quantitative RT–PCR analysis of P4.2, β-globin, and Rlim mRNAs in differentiating MEL cells transfected with shRNA expression plasmids for Ssbp2 and Ssbp3 or a control sequence (EGFP).

