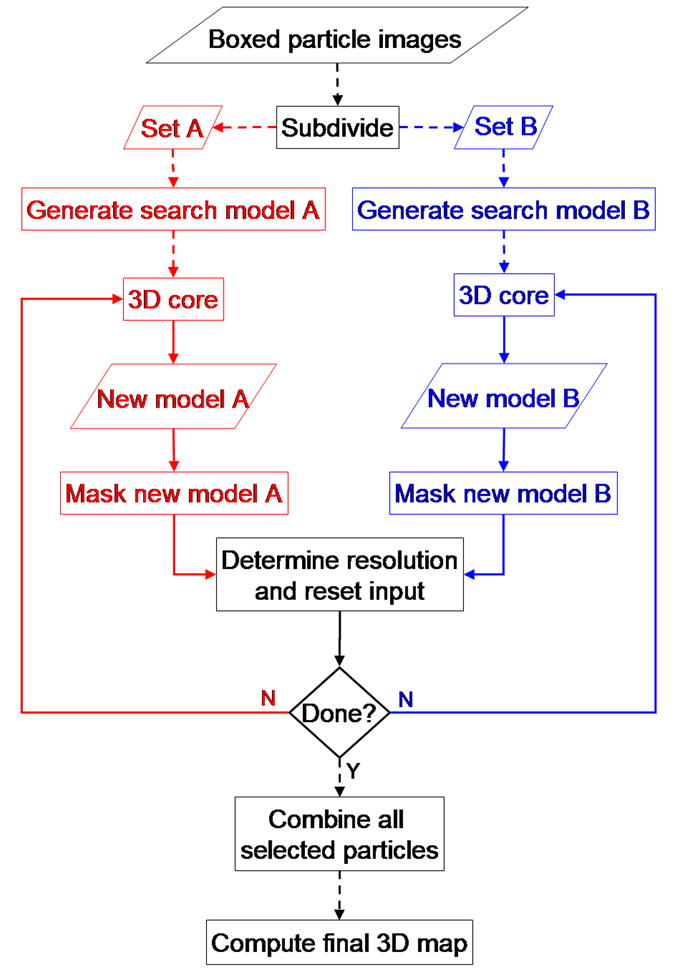
Fig. 3.

Flow chart of the unbiased model (UM) reconstruction method. The data set of boxed particle images is first subdivided into two subsets and each is processed in an independent branch following the 3DCore procedure illustrated in Fig. 2. Since each independent map is generated with an arbitrary handedness, for resolution determination the handedness of both maps, if necessary, must be fixed to be identical Dashed and solid lines indicate one-time and iterative operations, respectively.
