
Figure 6.
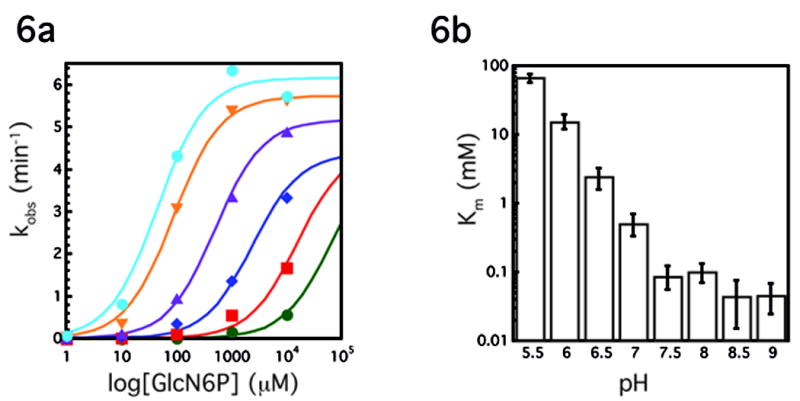
pH dependence of the Glms ribozyme reaction. A. Plot of kobs(min−1) versus log concentration of GlcN6P (μM) at various pHs, each curve represents the average of two experiments. Green circles, pH 5.5; red squares, pH 6.0; blue diamonds, pH 6.5; purple triangles, pH 7.0; orange triangles, pH 7.5; blue circles, pH 8.5. Experiments at pH 8 and pH 9 were omitted for simplicity. Lines represent best fit to the data. At pH 5.5, 6.0 and to a less degree 6.5, saturating GlcN6P concentrations could not be achieved. These data were fit assuming a kcat of 4.5 min−1. Because the reaction is so far from saturation, the resulting fits provide only a rough estimate for the Km at the lowest pHs. B. Km (mM) vs pH, each bar represents the average of two experiments.