
Fig. 7.
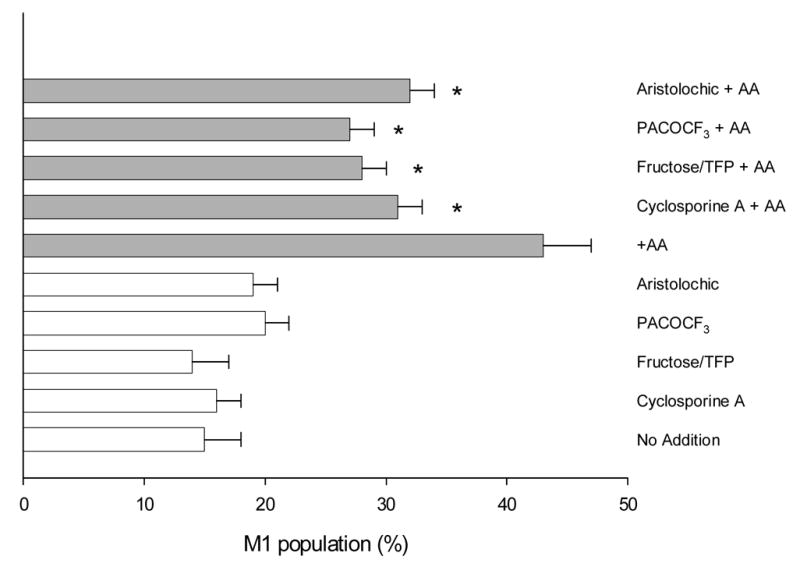
Mitochondrial membrane potential. E47 cells were preincubated with PTP inhibitors (fructose 10 mM/trifluoperazine 5 μ M or cyclosporine A 1 μ g/mL) or PLA2 inhibitors (100 μ M aristolochic acid or 10 μ M PACOCF3), and then exposed to AA (0 or 20 μ M) for 9h. Mitochondrial membrane potential was assessed by flow cytometry using rhodamine 123, and cells with low MMP are expressed as percentage of cells in the M1 fraction (low rhodamine 123 fluorescence). *Significantly different (p<0.05) with respect to cells incubated in the same conditions, in the absence of inhibitors.