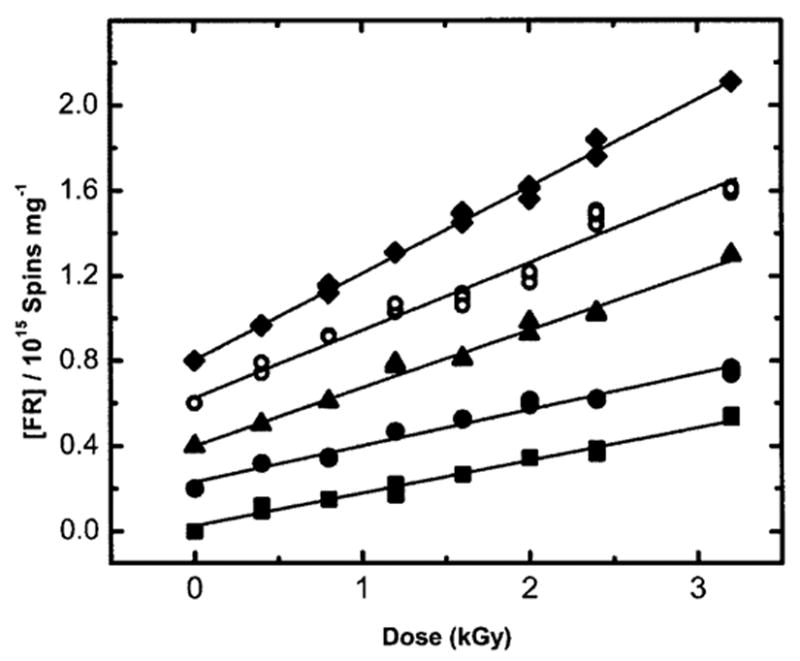
FIG. 4.

Plot of the free radical (FR) concentration as a function the X-ray dose for irradiated pUC18 plasmid samples at various Γ (mol water/mol nucleotide). The data includes plasmids at (■) Γ = 2.5, (●)Γ = 7.5, (▲) Γ = 11.5, (○) Γ = 15.0, and (♦) Γ = 22.5 mol water/mol nucleotide. The data for Γ = 22.5 have been published previously (32). X irradiation and EPR measurements were done at 4 K. A vertical offset of 0.2 units has been introduced between each curve. The linear region of the dose–response data has been fitted to a straight line by least squares. The free radical yield of the pUC18 sample at each Γ is determined from the slope of this line.
