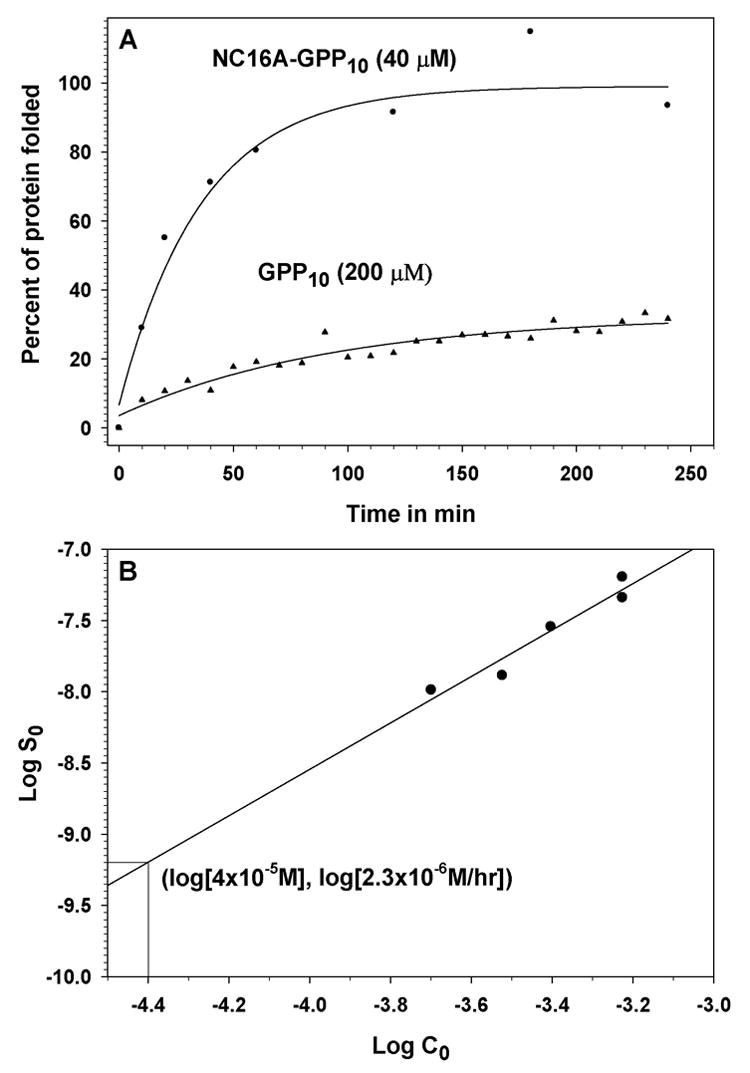
Fig. 4. Refolding of model proteins.

Panel A, This plot shows refolding curves for the model protein NC16A-GPP10 (closed circles) and the synthetic collagen peptide sGPP10 (closed triangles). Panel B, This plot shows the logarithm of initial rate (in M/sec) of triple helix formation of sGPP10 as a function of the logarithm of total chain concentration (in M).
