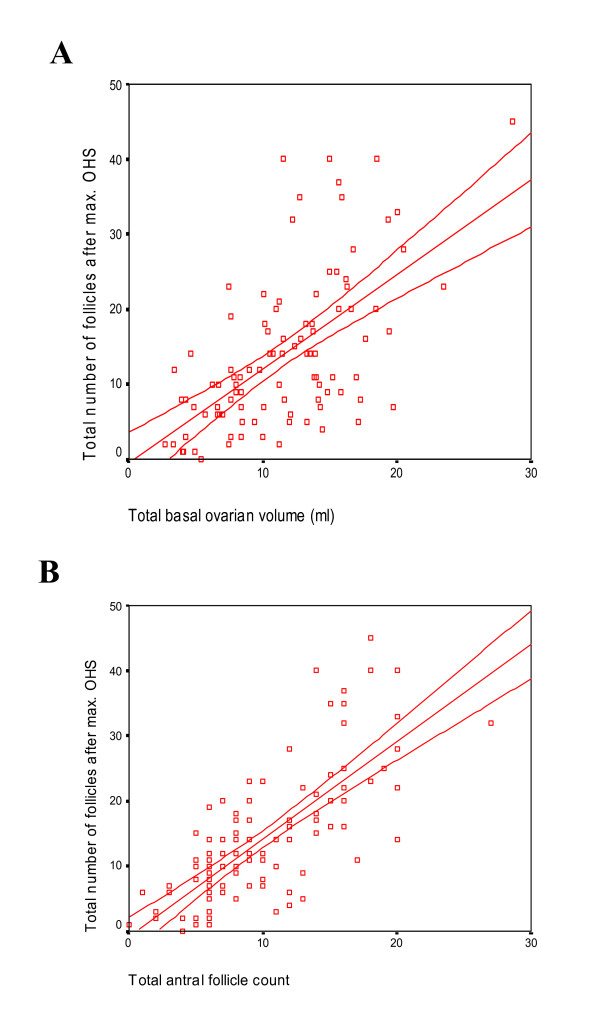
Figure 1.
(A) Plot of the number of follicles obtained after stimulation against the basal total ovarian volume. The three lines represent the regression line: Y = -0.460 + 1.255 × tot. ovarian volume with the 95% confidence interval (CI) of the mean. (B) Plot of the number of follicles obtained after stimulation against the basal total antral follicle count. The three lines represent the regression line: Y = -0.730 + 1.491 × tot. antral follicle count with the 95% CI of the mean.

