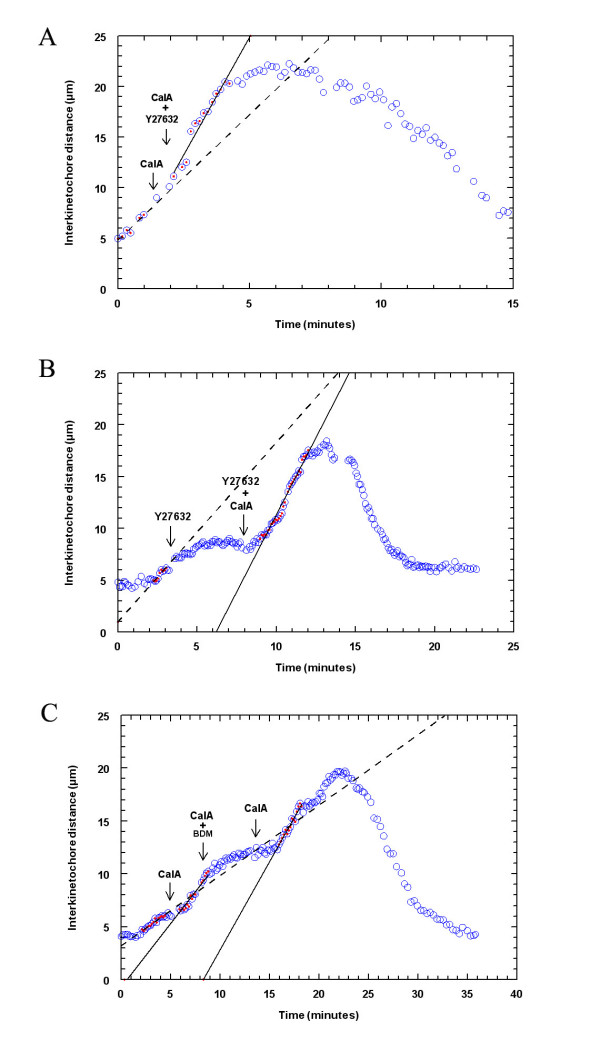
Figure 4.
(A) Chromosome movement in a cell treated with CalA (left arrow) and with Y-27632 in CalA (right arrow) during anaphase, illustrating one pair of half-bivalents that accelerated after CalA, did not slow after Y-27632, and moved backwards after reaching the poles. The dashed line represents linear regression through the circles with dots before addition of CalA and the solid line through the circles with dots after addition of Y27632 in CalA. (B) Chromosome movement in a cell treated with Y-27632 (left arrow) and with CalA in Y27632 (right arrow) illustrating one pair of half-bivalents that stopped after Y-27632, accelerated after CalA and moved backwards after reaching the poles. The dashed line represents linear regression through the circles with dots before addition of Y27632 and the solid line through the circles with dots after addition of CalA in Y27632. (C) Chromosome movement in a cell treated with CalA (left arrow), followed by BDM in CalA (mid arrow) and then by CalA again (right arrow) illustrating one pair of half-bivalents that accelerated after Calyculin, slowed after BDM, accelerated again after washing out BDM and moved backwards after reaching the poles. The dashed line represents linear regression through the circles with dots before addition of CalA and the solid lines regression through the circles with dots after addition of CalA (left line) and after washing out BDM (right line).

