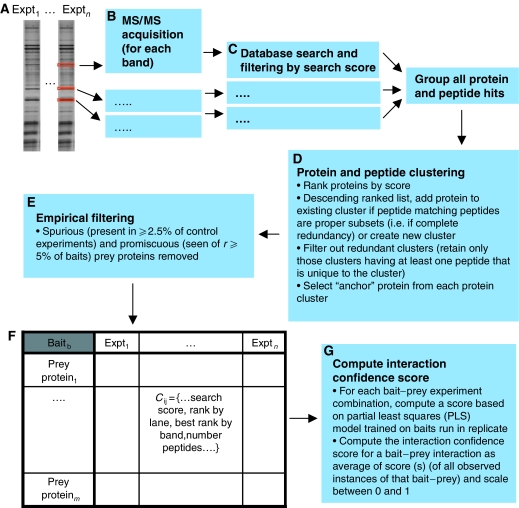
Figure 2.
IP-HTMS data analysis pipeline. (A–B) All bands from the lane(s) corresponding to a bait are extracted and MS/MS data acquired. (C) Data from each MS/MS acquisition are searched against a non-redundant human protein sequence database using the Mascot search engine. (D) Data from all bands corresponding to each bait are merged and protein and peptides clustered to generate a non-redundant list of protein identifications. (E) Spurious proteins and promiscuous binding proteins are removed. (F) A data table is produced for each bait protein with all of the scoring information, including scores and ranks by band and experiment. This data table contains all data required for the estimation of bait–prey interaction probability. (G) An interaction confidence score is calculated based upon a partial least squares model trained on the replicated subset of the data.

