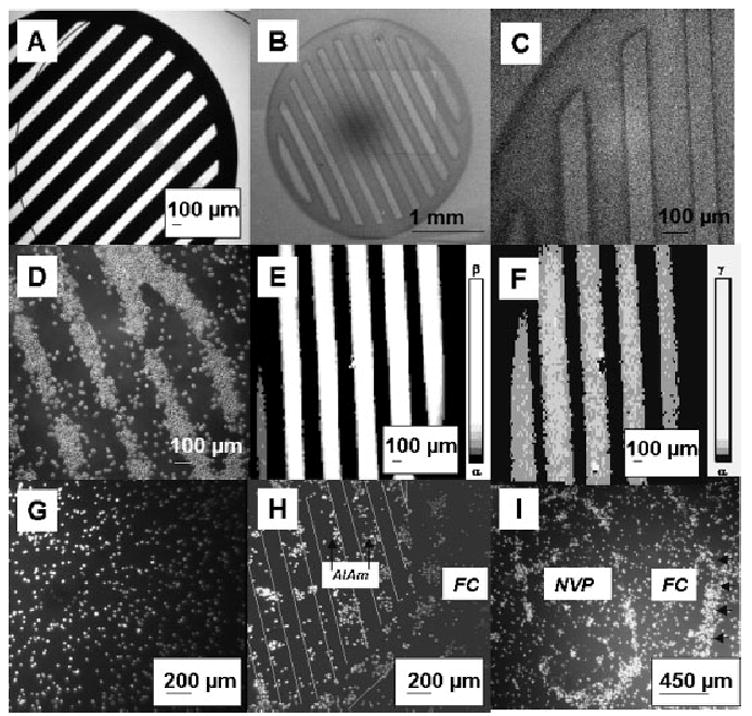
Figure 7.

Micropatterning and control images. A) Phase contrast microscopy image of one type of (striped) TEM grid employed as a mask. Bars, 184 μm; spaces 92 μm. B, C) Electron microscopy images of the same grid. D) Phase contrast microscopy image of IC-21 cells grown on micropatterned HxAl-FC. Majority of cells shown are adhered to the HxAl bars. Patterns appeared by day 7 and were maintained through day 9, when the experiment was terminated. Cell seeding density was 100 000 cells per 15 × 60 mm2 plate. E, F) Scanning Auger maps of a pattern generated using a striped TEM grid identical to those used for preparing samples for use in cell culture experiments. Areas of most intensity (lightest) are strongest Auger signal. Intensity scales shown in E and F: α = 0, β = 281400, γ = 520633. E) Auger fluorine map (from the KLL signal) and F) Auger nitrogen map (from the KLL signal). G) Fluorescence microscopy of a non-patterned control FC surface showing an even and random distribution of IC-21 cells. H) Fluorescence microscopy of IC-21 cells on an AlAm-FC striped micropattern. Preferential growth was observed on the AlAm region (thicker bar) of the pattern at day 2, although cells also grew on the FC regions (thinner bar and background). Seeding density was 136 000 cells per 15 × 60 mm2 plate. I) Phase contrast images of IC-21 cells grown on a bullet shaped micropattern of NVP-FC, dimensions 1 × 2 mm2, 4 d post-seeding at a density of 250 000 cells per plate. Plate background is also NVP. Macrophage cells grew well on both the NVP and FC surfaces showing no preference for the NVP region. Edge effects were observed at the margins of the TEM grid patterns for both the central bullet shape and the outer ring, which represents the edge of the TEM grid (arrows).
