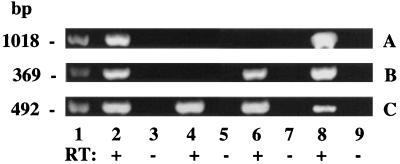
Figure 2.
Reverse transcription-coupled PCR analysis of gene expression. RNA from mammary glands of nonovariectomized bigenic (lanes 2 and 3), bigenic ovariectomized for 2 weeks (lanes 8 and 9), nonovariectomized monogenic GAL-4 (lanes 6 and 7), and transgene-negative (lanes 4 and 5) mice was subjected to PCR analysis either without (−RT) or (+RT) after reverse transcription. (A) PR-A transgene expression corresponding to the expected fragment of 1031 bp. (B) GAL-4 gene expression corresponding to the expected fragment of 360 bp. (C) Endogenous PR expression corresponding to the expected fragment of 460 bp. Lanes 1 represent standard DNA with molecular weights indicated on the left.

