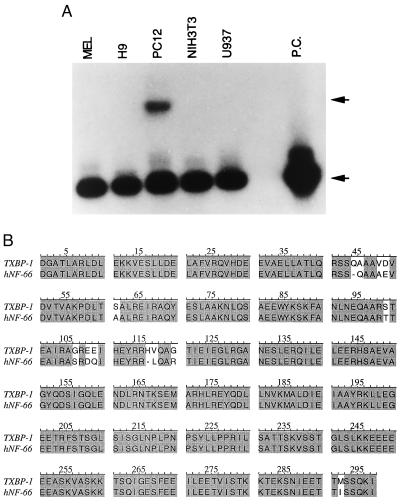
Figure 1.
(A) Distribution of TxBP-1 RNA in different cell lines. Total RNA isolated from MEL, mouse erythroleukemic cells; H9, human T cell line; PC12, undifferentiated rat pheochromocytoma cells; NIH 3T3, mouse fibroblastic cells; and U937, monocytic cell lines was subjected to reverse transcription. The reverse-transcribed cDNA was subjected to PCR by using β-actin and TxBP-1 primers as described in Methods. The amplified products were subjected to Southern blot analysis, and the membrane was hybridized with end-labeled 32p β-actin and TxBP-1 oligonucleotides. The membrane was exposed to x-ray film. Upper arrow denotes the TxBP-1; lower arrow denotes the β-actin and PC stands for positive control (β-actin). (B) Homology between the amino acid sequences of TxBP-1 and human α-internexin-NF66 (hNF-66).

