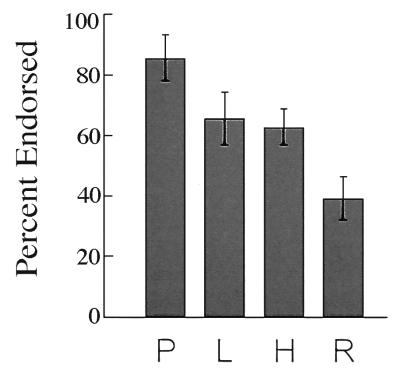
Figure 2.
Classification of new dot patterns after studying 40 exemplar patterns. The endorsement rate varied in accordance with how closely the test items resembled the study items. P, instances of the prototype (four patterns per test); L, low distortions of the prototype (20 patterns per test); H, high distortions of the prototype (20 patterns per test); R, random patterns (40 patterns per test). Error bars show the SEM.

