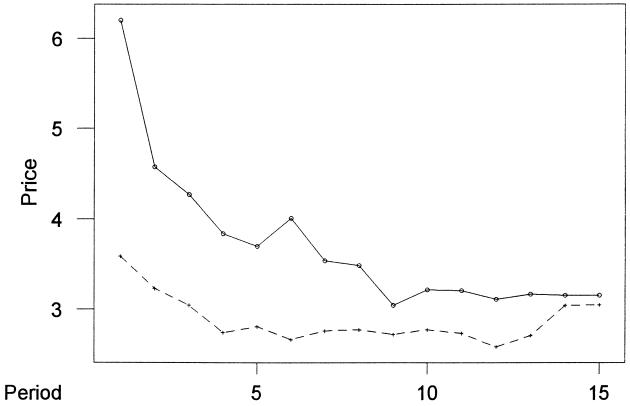
Figure 1.
Mean period prices for experiments. For each period the mean of all of the experiments entailing an initial surplus of cash relative to asset is computed and displayed by the solid line. Similarly, the means for the experiments with an initial surplus of asset are displayed by the dashed line. The mean cash rich values are higher for the duration of the experiment, though the difference is most pronounced at the outset.

