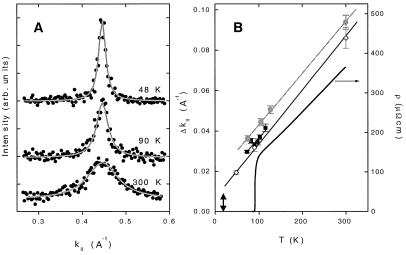
Figure 1.
(A) Momentum distribution curves for different temperatures. The solid lines are lorentzian fits. (B) Momentum widths of MDCs for three samples (circles, squares, and diamonds). The thin lines are T-linear fits. The resistivity (solid black line) is also shown. The double-headed arrow shows the momentum resolution of the experiment. Figure courtesy of P. D. Johnson (Brookhaven National Laboratory). Reproduced with permission from ref. 6 (Copyright 1999, American Association for the Advancement of Science)].

