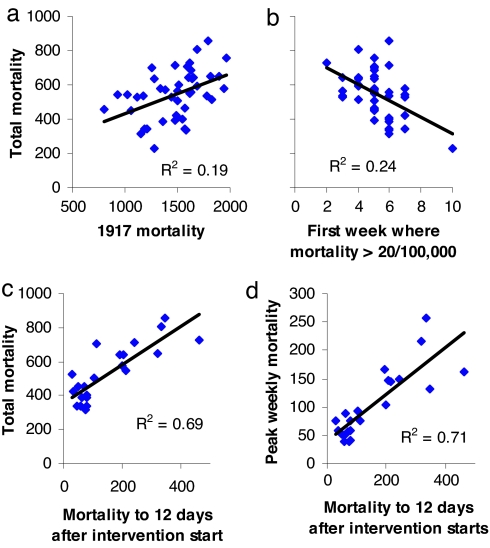
Fig. 1.
Predictors of excess influenza-related mortality in 1918–1919. Correlation of peak mortality (per 100,000) with all-cause mortality in 1917 (a), total mortality with the week (counting from the week of September 7–13, weekly mortality first exceeds 20/100,000) (b), total mortality with mortality up to 12 days after start date of interventions (c), and peak mortality with mortality up to 12 days after start date of interventions (d). a and b show data for the 45 U.S. cities for which mortality data were relatively complete. c and d show data for the 23 cities for which the start date of public health interventions was known. Peak and total 1918 mortality refers to excess pneumonia- and influenza-related mortality in the period September 7, 1918, to May 10, 1919. Regression shows all slopes to be significantly different from zero (P < 0.01).

