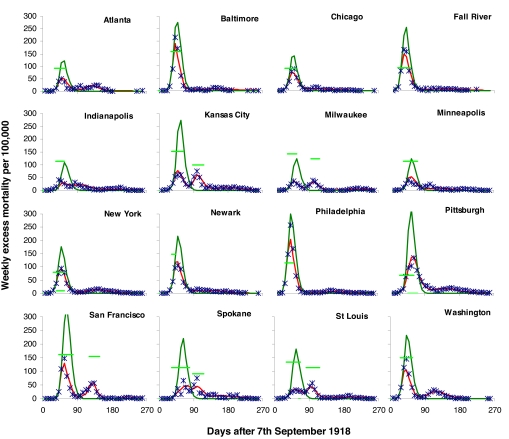
Fig. 3.
Weekly excess mortality (per 100,000) resulting from the 1918 pandemic in 16 U.S. cities (blue points), compared with the fit of model variant 4, Table 1 (red curves). This variant fits R0 and T, the duration of the population “memory” of past mortality, as parameters common to all cities and other parameters as city-specific. Estimated weekly mortality, had controls not been implemented, is also plotted (dark-green curves). The effectiveness and period of implementation of control measures are also shown as light-green horizontal lines; horizontal position and length, indicate start date and duration of interventions, and vertical position indicates estimated effectiveness. The top of the vertical axis is 100% effectiveness, and the bottom of this axis is 0%.

