Figure 1.
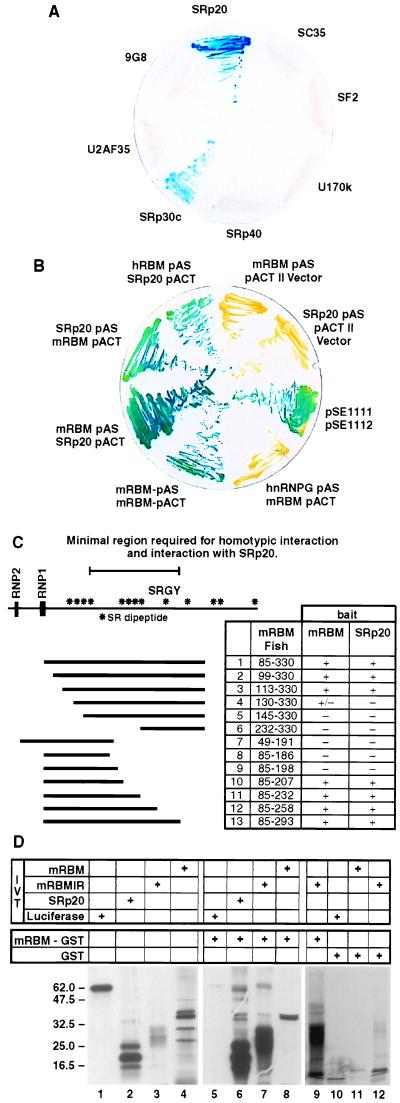
RBMp interacts with both SR proteins and itself. (A) Interactions between mRBMp and a panel of SR proteins. (B) Heterotypic and homotypic interactions of RBM proteins. (C) Mapping of the minimum regions of mRBM required for homotypic and heterotypic protein interactions. mRBMp is shown as a cartoon with the positions of SR dipeptides shown as asterisks, and the position of the SRGY tetrapeptide (considerably expanded in hRBM) is indicated. The position of the RRM (RNP1 and RNP2 motifs) is indicated. The contents of each of the deletion constructs used to map the interaction region (cloned in pAS: mRBM fish) is shown as a solid line, alongside its amino acid content and whether it interacted (+) or not (−) with mRBM bait (amino acids 85–330 cloned in pACT) or SRp20 bait (full-length SRp20 cloned in pACT). Interactions were scored as positive if multiple (at least 10) individual colonies gave LacZ activity. (D) Agarose beads coated in the mRBMp interaction region (but not GST alone) pull-down IVT mRBM and SRP20 proteins.

