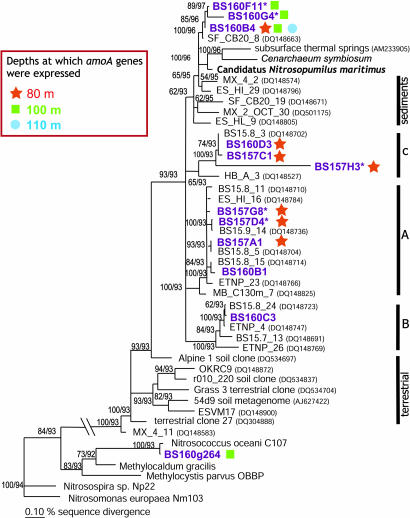
Fig. 3.
A maximum likelihood tree of bacterial and crenarchaeal amoA obtained in the Black Sea water column. Branching patterns are supported by >50% bootstrap values (1,000×) by means of maximum parsimony and distance methods, and their respective %bootstrap values are denoted. Only representative OTUs (<98% sequence identity) are shown (in bold). An OTU marked with an asterisk indicates its uniqueness to that depth. The marine A, B, and C and sediment clusters previously defined (20) are also shown. The symbols (stars, squares, circles) indicate expressed sequences.

