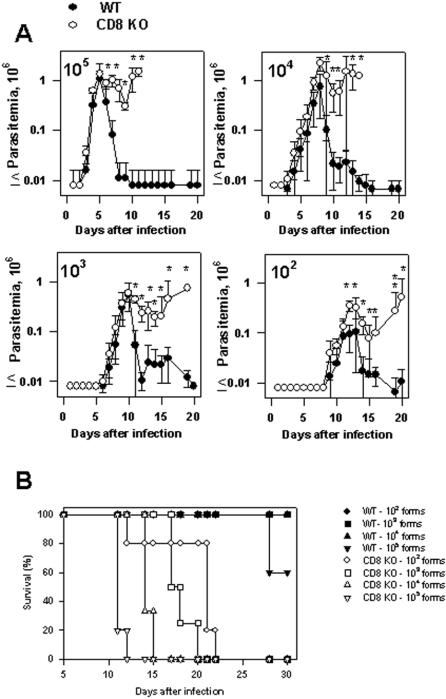
Figure 2. Infection in WT C57BL/6 or CD8 KO mice challenged with different doses of T. cruzi.
Groups of WT C57BL/6 or CD8 KO were infected i.p. with 102,103, 104 or 105 bloodstream trypomastigotes of the Y strain of T. cruzi. (A) Course of infection, estimated by the number of trypomastigotes per mL of blood. Results represent the mean values of 4–5 mice±SD. The parasitemias of WT C57BL/6 or CD8 KO mice were compared by One-way Anova. Asterisks denote statistically significant differences (P<0.05). (B) Kaplan-Meier curves for survival of WT C57BL/6 or CD8 KO infected mice with different doses of parasites. Statistical analyses were performed using LogRank test comparing the different mouse groups. Initially, we compared groups of WT C57BL/6 infected with different doses. The results of the comparison showed no statistically significant differences among them. Subsequently, we compared WT C57BL/6 or CD8 KO infected with each different dose of parasites. The results of the comparison showed statistically significant differences in between C56BL/6 or CD8 KO challenged with each parasite dose (P<0.0001, in all cases). Finally, statistical analyses were performed comparing the groups of CD8 KO infected with different doses. The results of the comparison were as follows: i) CD8 KO 102×CD8 KO 103 (P = 0.0025); ii) CD8 KO 102×CD8 KO 104 (P = 0.0046); iii) CD8 KO 102×CD8 KO 105 (P = 0.0016); iv) CD8 KO 103×CD8 KO 104 (P = 0.01); v) CD8 KO 103×CD8 KO 105 (P = 0.0035); vi) CD8 KO 104×CD8 KO 105 (P = 0.0082).

