Figure 2.
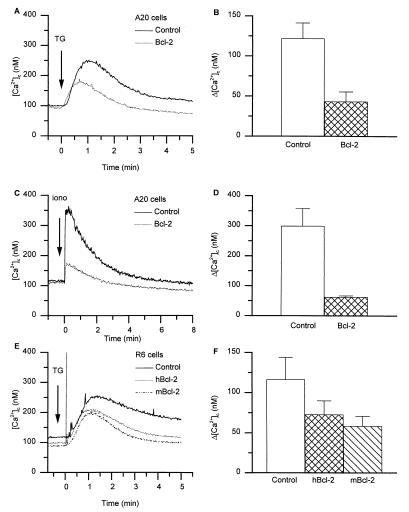
Bcl-2 reduces the amount of releasable Ca2+ from intracellular stores. (A) [Ca2+]c trace in control and Bcl-2-expressing A20 cells in response to 100 nM TG. (B) Peak [Ca2+]c increase in response to 100 nM TG in control and Bcl-2-expressing A20 cells. (C) [Ca2+]c trace in control and Bcl-2-expressing A20 cells in response to 100 nM ionomycin. (D) Peak [Ca2+]c increase in response to 100 nM ionomycin in control and Bcl-2-expressing A20 cells. (E) [Ca2+]c traces in control R6 cells and R6 cells expressing hBcl-2 or mBcl-2, in response to 100 nM TG. (F) Peak Ca2+ increase in response to 100 nM TG in control R6 cells and R6 cells expressing hBcl-2 or mBcl-2 (the initial short-lasting upstroke seen in R6-hBcl-2 cells is pipetting artifact). Data shown in B, D, and F are mean ± SEM from four independent experiments.

