Figure 3.
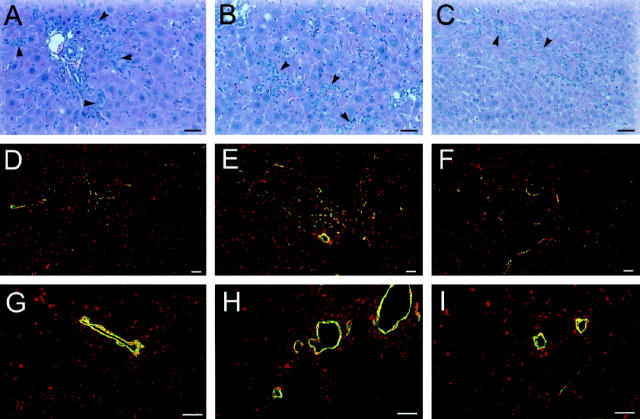
Oval cell proliferation in retrorsine-exposed rat livers after PH. A−C: H&E-stained liver sections of retrorsine-exposed rats at 3, 7, and 30 days post-PH, respectively. D−F: Indirect immunofluorescence analysis of OV6 in liver cryosections from retrorsine-exposed rats at 3, 7, and 30 days post-PH, respectively. G−I: Indirect immunofluorescence analysis of OV6 in liver cryosections from control rats at 3, 7, and 30 days post-PH, respectively. Oval cell proliferation in this model was minimal. Evidence of oval cell proliferation after PH in retrorsine-exposed rats is observed in the vicinity of the portal tracts at 3 days post-PH (A and D), reaching a peak response by 7 days post-PH (B and E), then slowly diminishing until 30 days post-PH (C and F) when remaining oval cells colocalize with megalocytes. There is no oval cell proliferation in control rats after PH at the same time points (G−I). Only bile ducts are OV6-positive. Bar, 50 μm. Arrows indicate oval cells.

