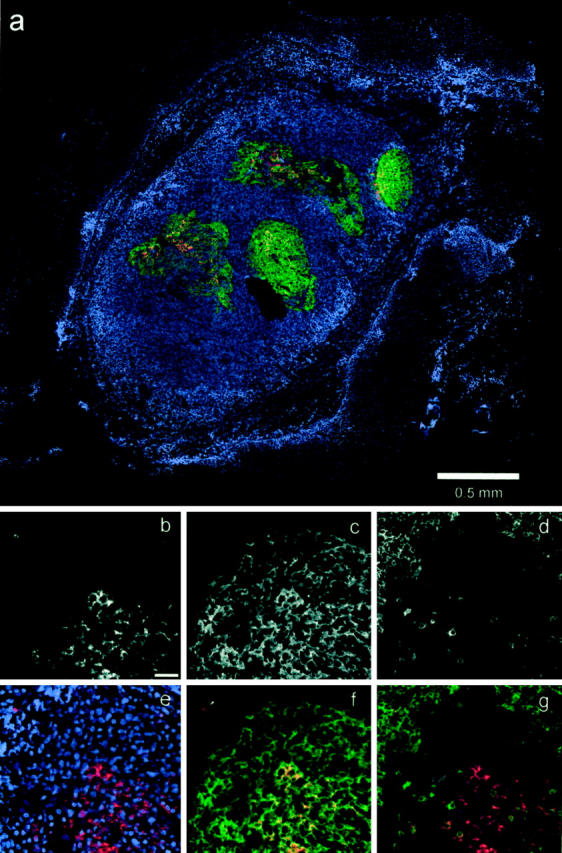
Figure 2.

IHC detection of HIV-1 p24 and cellular markers. a: Color overlay (blue, nuclei; red, p24; green, FDC; red/green combinations appear as orange to yellow) shows an entire section composed of 25 montaged fields (original magnification, ×10). b–g: Show the same high-power field of a lymphoid follicle (original magnification, ×40; scale bar in b, 50 μm). b–d: Black and white images of the p24 (Cy3), FDC (Cy5), and T cell (Alexa488) fluorescent channels. e–f: Color overlays, as follows: overlay of nuclei (blue, DAPI) and p24 (red; e); nearly complete co-localization (orange to yellow) of p24 (red) and FDC (green) within the follicle, whereas the infected cell (arrow) does not co-localize with FDC (f); co-localization of the infected cell with CD3 (yellow), no co-localization of CD3 (green) with follicular p24 (red) (g).
