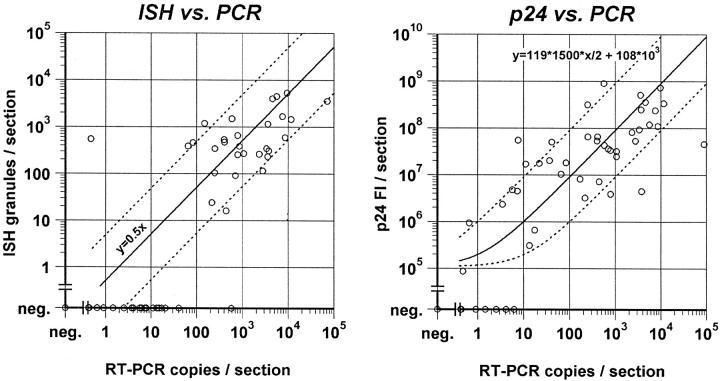
Figure 5.
HIV-1 RNA ISH expressed as fluorescent granules per section (left) and p24 ICC fluorescent intensity (Fl) per section (right) compared with HIV-1 RNA copies/section. Solid lines show expected theoretical relationship based on the formulas shown, and dotted lines indicate a range of ±1 log10 (see text for details).

