
Figure 6.
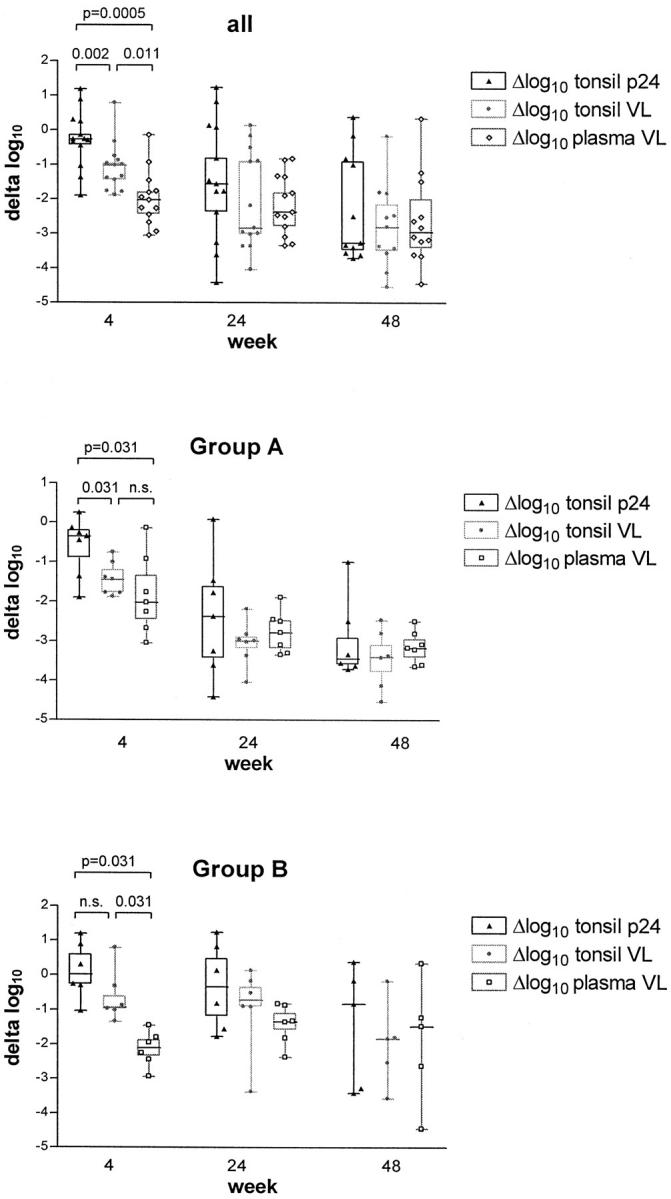
Decreases from baseline in HIV-1 RNA (VL) in plasma, and HIV-1 RNA (VL) and p24 in lymphoid tissue; in all patients (top), and in those without (group A) and with (group B) viral rebound during treatment. Box and whiskers show median, 25th, and 75th percentile and range of the data. n.s., not significant; VL, viral load.