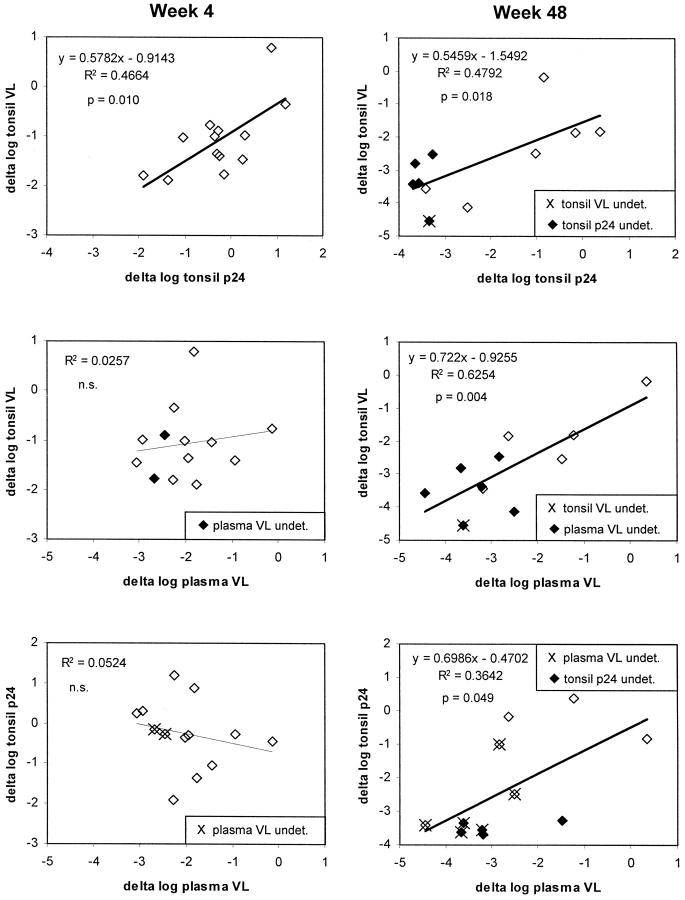
Figure 7.
Correlations of decreases from baseline to week 4 (left) and 48 (right) in HIV-1 RNA (VL) in plasma, and HIV-1 RNA (VL) and p24 in lymphoid tissue. For calculations of log10 decreases, measurements below the detection limit were assigned the lower limit of detection (shown with solid data points or marked with X; see legend inserts).

