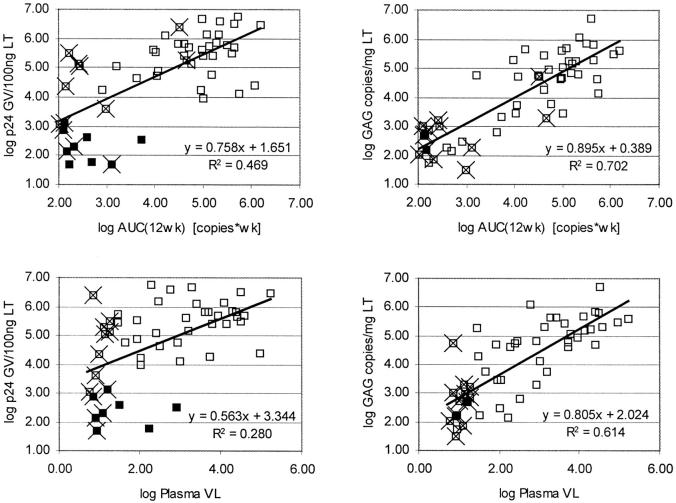
Figure 8.
HIV-1 RNA (VL) and p24 in lymphoid tissue correlate better with area under the curve of HIV-1 RNA (VL) in plasma throughout the last 12 weeks before biopsy (top) than with the actual plasma HIV-1 RNA (VL) at the time of biopsy (bottom). Solid data points represent samples with undetectable tonsil p24 (left) or tonsil VL (right) at the corresponding detection limit, measurements from time points with undetectable plasma VL are marked with X. GV, gray value (fluorescent intensity); wk, week; VL, viral load.

