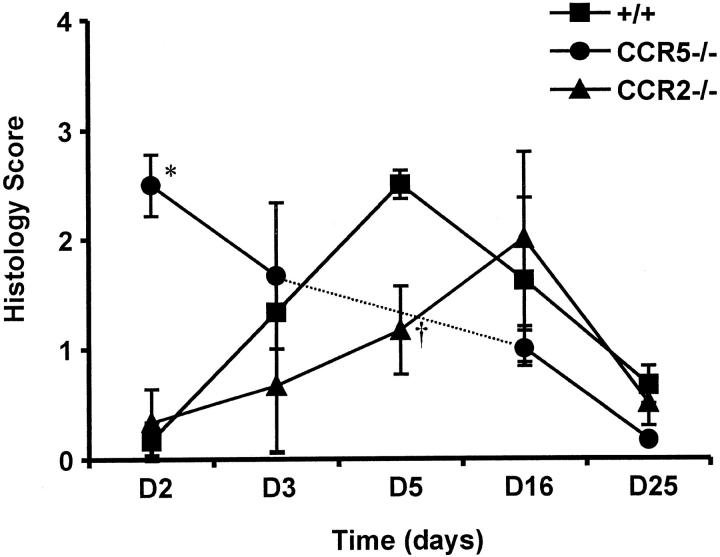
Figure 4.
Time course of pulmonary pathology scores for surviving +/+, CCR5−/−, and CCR2−/− mice after influenza virus infection. All lung histology sections were scored (blinded) 0+ to 4+ based on the severity of inflammation and tissue damage. For this experiment, CCR5−/− mice were not analyzed at day 5 postinfection. Each data point represents the average of 3 to 5 mice per group for each time point. *, P = 0.002 versus +/+ group, and †, P = 0.05 versus +/+ group both by Student’s t-test.

