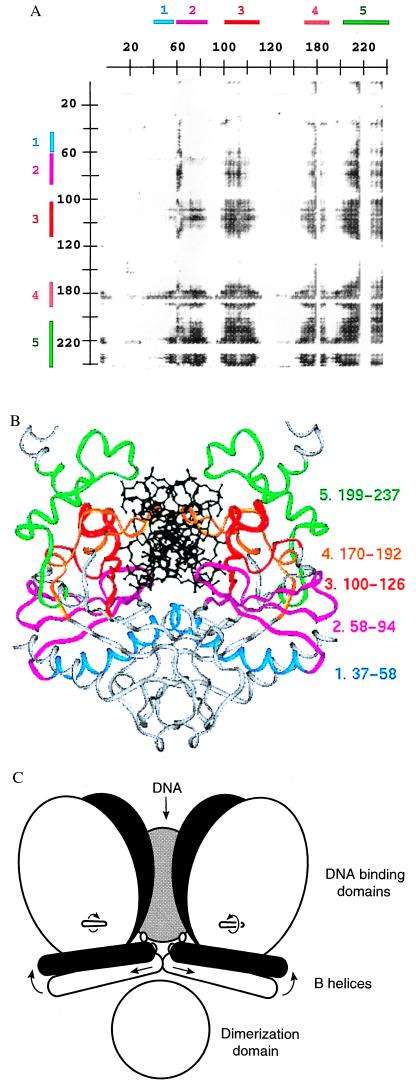
Figure 2.
(A) Cross-correlation matrix plot of the distances between α-carbons i and j of each DNA-bound structure, and roll angle of the DNA at the center TA step. Shown is the upper right quadrant of the full matrix. Residues 1–245 of subunit I are on the horizontal axis, and residues 1–245 of subunit II are on the vertical axis. A gray point is placed for α-carbon atom pairs having |r| > 0.90 (i.e., the distance between these atoms is significantly correlated with roll angle for the five structures I-IV and NS). Shading of points from gray to black indicates values of |r| ranging from 0.9 to 1.0. Colored segments 1 through 5 (Upper and Left) are assigned by inspection of this plot. Residues 184–187 in segment 4 and 221–228 in segment 5 are not included in the calculation because they are disordered in the nonspecific complex; these residues appear as stripes with discrete borders. Similar plots were calculated with each of the other two measures of DNA-bending angle (Table 3) as well as with random values for the bend angle. The total number of points (i, j) having |r| > 0.90 are: using center-step bend of the DNA, 28,251; using roll angle at the center step, 34,681; using overall bend of the DNA, 10,465; using random values for bend angles, 1,893. Segments 1 through 5 appear in the three plots using experimental DNA-bending angles but not in the plot using random bend angles. Inspection of other quadrants of the matrix plot shows no significant correlations for interatomic distances within either subunit. Analysis of cross-correlation coefficients has also been used to assess correlated atomic displacements in molecular dynamics simulations of proteins (32). (B) Ribbon diagram of the specific complex in crystal form IV color coded by segments defined by the plot in A. (C) Schematic drawing of the protein conformational changes occurring with DNA bending. The white and black models represent complexes containing DNA which is bent to a lesser and greater degree, respectively. As the DNA bends, the B helices translate apart and rotate up into the DNA-binding site, and the DNA-binding domains rotate about the axes indicated.

