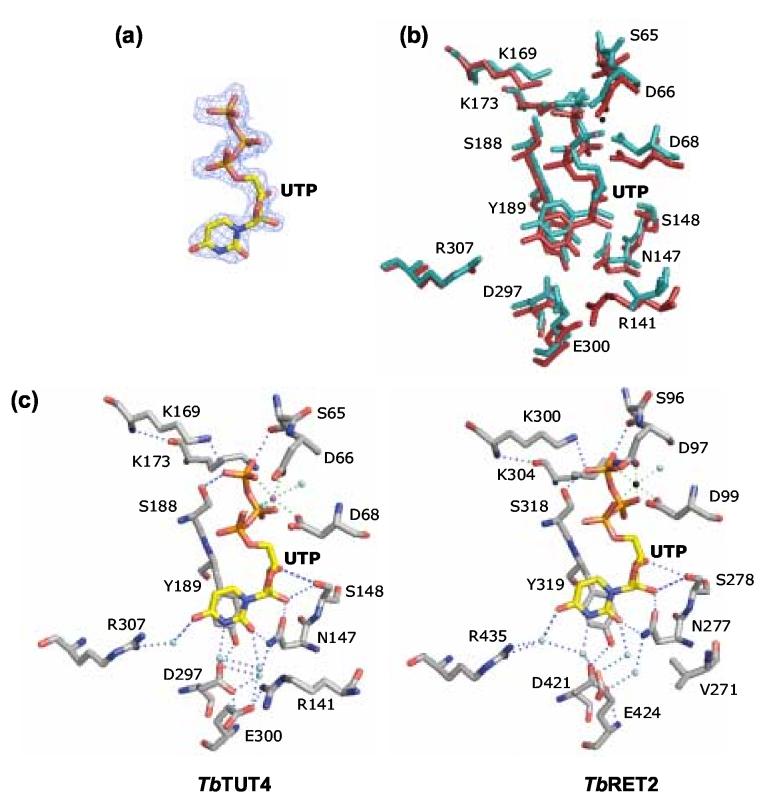
Figure 6.
Key protein-UTP contacts in the UTP binding site. (a) UTP observed in molecule A shown with electron density from a composite annealed omit map contoured at 1.0 σ. (b) Superposition of the active sites of TbRET2 (teal) and TbTUT4 (red). Residue labels are for TbTUT4. (c) Comparison of UTP binding via active site residues and their respective hydrogen bond networks for TbTUT4 and TbRET2. Selected water molecules (cyan spheres) were included to illustrate their significance in coordinating the uracil base while others were left out to improve clarity. The metal cations are shown as spheres: for TbTUT4 a Mg2+ (magenta sphere), and for TbRET2 a Mn2+ (black sphere). Figure generated using PyMOL (http://www.pymol.org).

