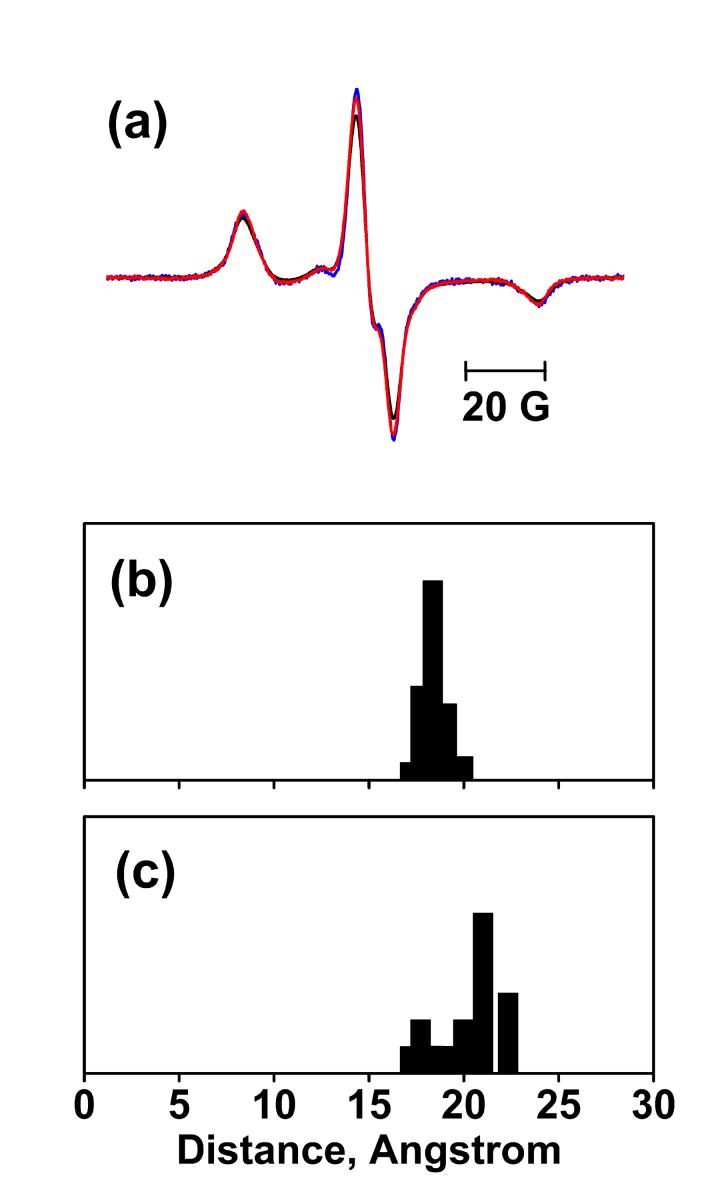
Figure 5.
EPR spectra at 120K and distance calculation for L61R1/K129R1. (a) Sum of spectra of the L61R1 and K129R1 single mutants without illumination (blue), spectrum of L61/K129R1 before illumination (black), and the spectrum of L61R1/K129R1 after illumination (red), superimposed. All spectra are normalized to the same spin number. Panels (b) and (c) show the deconvoluted distance distributions of L61R1/K129R1 in the BR and O states, respectively.

