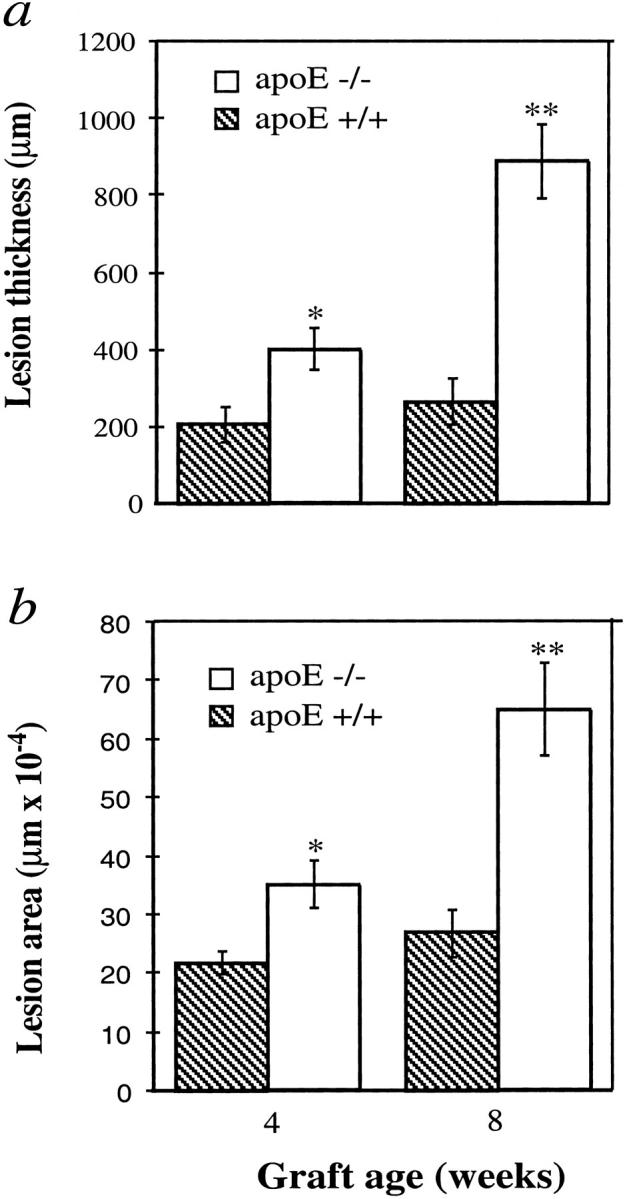
Figure 2.

Increased lesion thickness and area of vein grafts in apoE−/− mice. The procedure for animal models and the preparation of HE-stained sections are the same as those described in the legend to Figure 1 ▶ . Thickness was measured microscopically. Four regions of each section along a cross were measured and 5 sections per animal selected. Lesional areas were determined with a laser microscope, as described in Materials and Methods. Data shown as graphs of neointima or lesion thickness (a) and area (b) (means ± SEM) obtained from 6 or 8 animals per group at each time point. Significant difference between apoE−/− and apoE+/+ groups were seen. *P < 0.05, **P < 0.0001.
