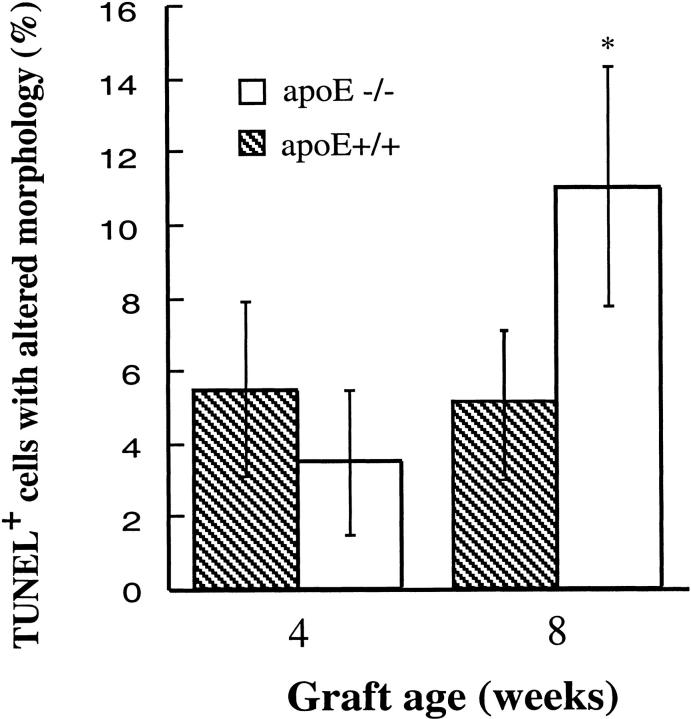
Figure 7.
Statistical data of TUNEL-positive cells in vein grafts. TUNEL-stained sections were prepared as described in the legend to Figure 6 ▶ . TUNEL-positive and total nuclei in neointima or atheroma of vein grafts were enumerated under the microscope. Data are means ± SD of 6 to 8 animals per time point each group. *Significant difference between apoE−/− and apoE+/+ mice, P < 0.05.

