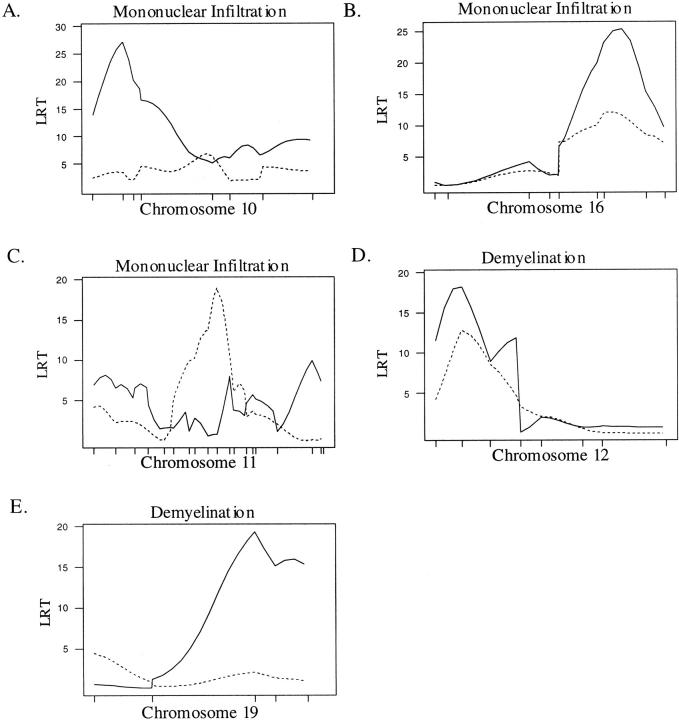
Figure 3.
CIM results for the male population. A solid line represents the plot of the LRT statistic for the brain whereas the broken line represents a plot of the LRT statistic for the SC. Tick marks on the x axis represent the positions of microsatellite markers. Permutation-derived significance cutoffs were based on 1000 permutations at α = 0.05. A–C: Composite interval maps with significant linkage for the mononuclear cell infiltration. Significance cutoffs for this trait are LRT = 17.9 for the brain and 16.6 for the SC. D–E: Composite interval maps with significant linkage for demyelination. Significance cutoffs for this trait are LRT = 18.1 for the brain and 18.0 for the SC.

