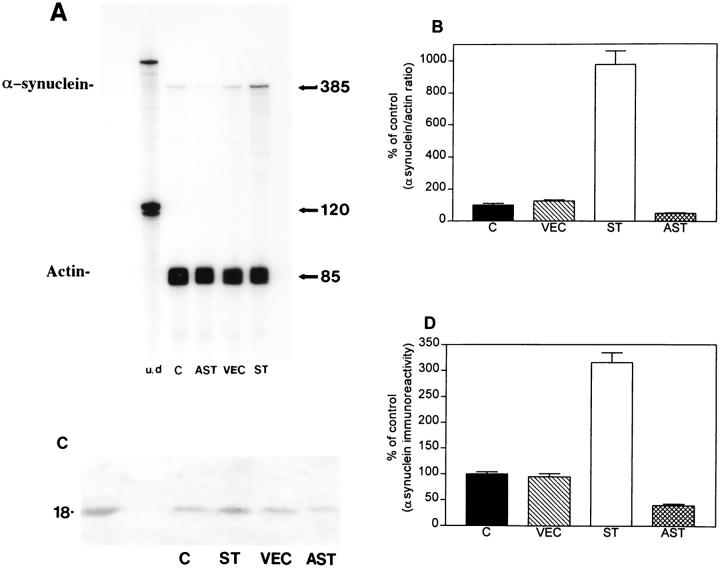
Figure 1.
Characterization of patterns of murine α-synuclein expression in GT1-7 cells. A: Representative autoradiogram of the RPA showing murine α-synuclein mRNA levels in C (control nontransfected), AST (antisense transfected), VEC (vector-transfected), and ST (sense-transfected) cells. Protected fragment for murine α-synuclein was detected at 385 bp, whereas actin was detected at 85 bp. The left-most lane shows signal of undigested (u/d) radiolabeled riboprobes, whereas the other lanes contain riboprobes of RNase-digested samples. B: PhosphorImager analysis of murine α-synuclein mRNA signals (expressed as percent over control) showing that ST cells expressed ninefold over control, whereas AST cells expressed 50% of control levels. C: Representative autoradiogram of the Western blot showing that the α-synuclein antibody recognized a band at ∼18 kd. The left-most lane shows signal of the recombinant α-synuclein protein. C, control nontransfected; AST, antisense transfected; VEC, vector-transfected; and ST, sense-transfected cells. D: PhosphorImager analysis of α-synuclein signals from semiquantitative Western blots showing, in the cytosolic fractions, that ST cells expressed twofold over control, whereas AST cells expressed 50% of control levels.

