
Figure 4.
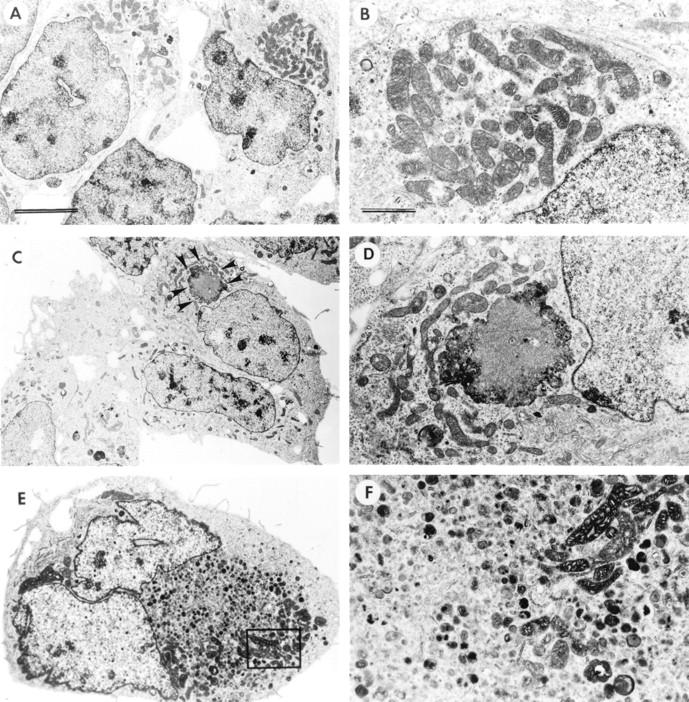
Ultrastructural analysis of other morphological alterations in transfected GT1-7 cells. Low power (original magnification, ×5,000; scale bar, 5 μm) (A) and high magnification (original magnification, ×20,000; scale bar, 1 μm) (B) views of VEC-transfected cells demonstrating normal organelles. Low power (original magnification, ×5,000) (C) and high magnification (original magnification, ×20,000) (D) views of ST cells demonstrating electrodense intracytoplasmic inclusions (arrowheads). E and F: Furthermore ST cells displayed large numbers of secondary lysosomes and laminated bodies in their cytoplasm and complete lack of neuritic processes (original magnification, ×15,000).