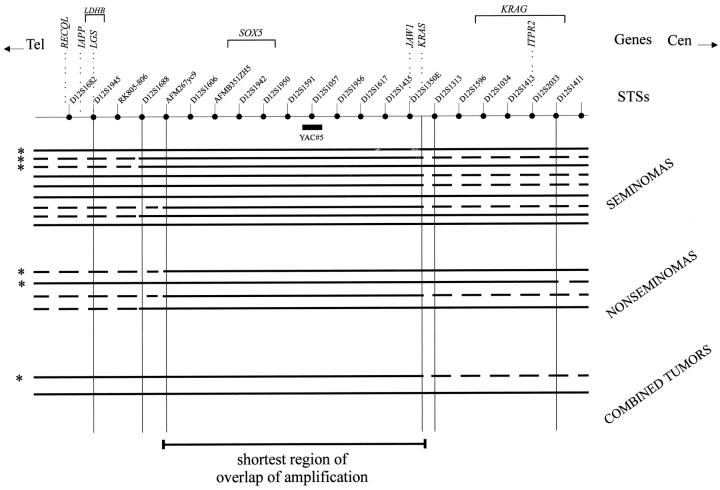
Figure 1.
Schematic representation of the physical map of the 12p11.2-p12.1 region. Genes, STSs, and the position the YAC#5 probe (positive for STS D12S1057) are indicated. The results of the double-fluorescent in situ hybridization experiments performed on frozen tissue sections to determine the shortest region of overlap of amplification are shown. The continuous bold lines indicate the regions included in the restricted 12p amplification, and the dotted lines indicate the regions outside the amplification. The probes specific for STSs D12S1945, D12S1688, AFM267yc9, K-RAS, D12S1313, and D12S1411 are used for these analyses. The results are shown per histological subgroup (seminomas, nonseminomas, and combined tumors). The tumors studied in our previous analysis, 45 are indicated by an asterisk. Note that three breakpoints map between AFM267yc9 and D12S1688, and seven between AFM267yc9 and D12S1945 at the distal side, and six between K-RAS and D12S1313 at the proximal side. The shortest region of amplification encompasses the genomic fragment between AFM267yc9 and K-RAS.

