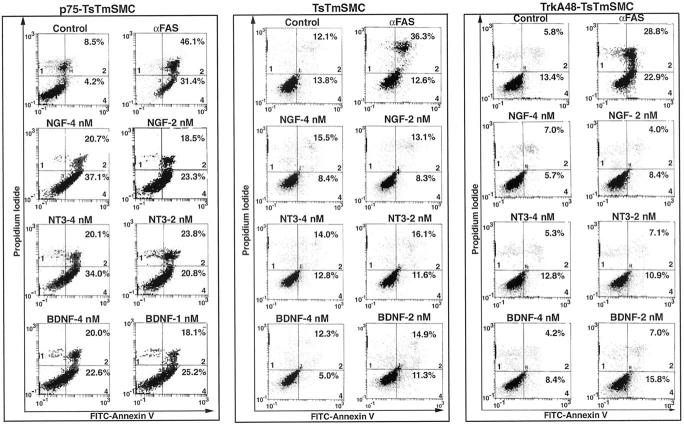
Figure 6.
Flow cytometric analysis of annexin V binding to p75-TsTmSMC, native TsTmSMC, and trk48A-TsTmSMC. TsTmSMC cell lines were grown for 3 days at 39.5°C followed by treatment with the neurotrophins at the indicated doses. After 15 hours, a cell suspension was prepared and the cells were stained with FITC-conjugated annexin V and propidium iodide, as described in Methods, and flow cytometric analysis was performed. Histograms from one of three duplicate experiments for each cell line is shown. Quadrants 1, 2, and 4 are labeled in the lower left (quadrant 1) and lower right (quadrants 2 and 4) corners. The percentage of cells in the early and late stages of apoptosis are indicated in quadrants 4 and 2, respectively.

