
Figure 7.
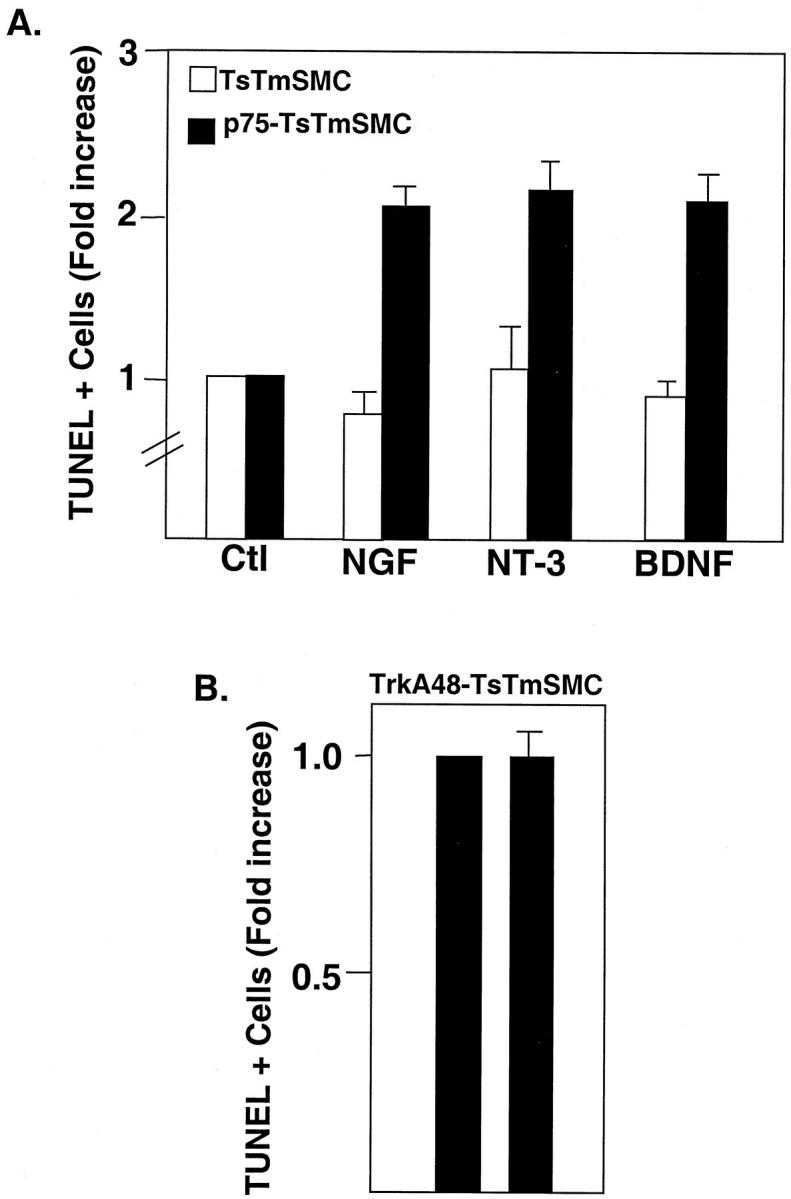
A: Quantitative analysis of the TUNEL assay for TsTmSMC and p75NTR-TsTmSMC after treatment with the neurotrophins (each 4 nmol/L). Data are presented as -fold increase of TUNEL-positive cells over control, nontreated cells and are the means ± SE of one of three duplicate experiments for both native TsTmSMC and p75-TsTmSMC. In each experiment, there were two replicates per treatment group. Percentage of TUNEL-positive cells in the absence of exogenous ligand: TsTmSMC = 2.1 ± 0.4%; p75TsTmSMC = 4.6 ± 0.9%. B: Quantitative analysis of TUNEL assay for trkA48-TsTmSMC. Data are presented as in A and are from one of two duplicate experiments, two replicates per experimental group. Percentage of TUNEL-positive cells in the absence of ligand = 1.9 ± 0.4%.