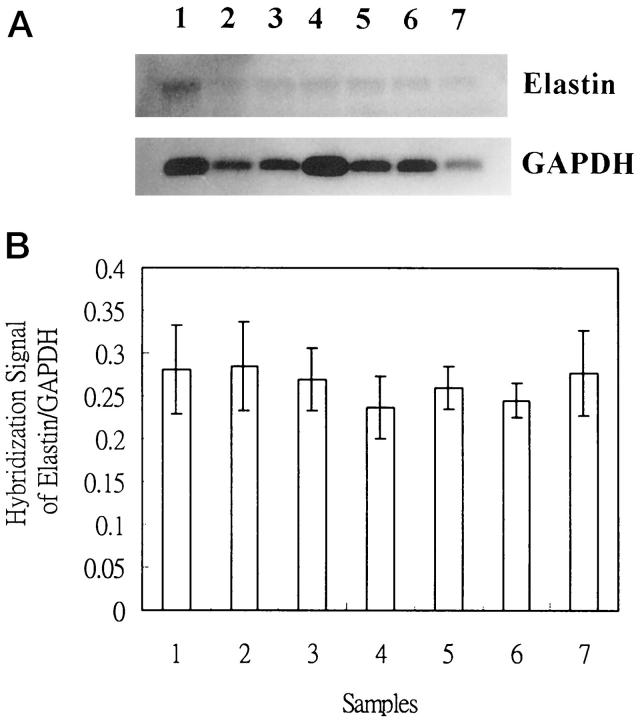
Figure 2.
Tropoelastin and glyceraldehyde-3-phosphate dehydrogenase mRNA levels at steady-state and after UV irradiation in conjunctival fibroblasts and pinguecular fibroblasts of pterygia. A: Samples 1, 2, and 3 represent normal conjunctival fibroblasts; samples 4 and 5 represent conjunctival fibroblasts which received 3 and 6 mJ/cm 2 of UVB irradiation, respectively; samples 6 and 7 represent pinguecular fibroblasts. B: Quantitative study with the PhosphoImager scanner reveals no differences in tropoelastin mRNA expression between these groups (five repeated measurements in each mRNA, one-way analysis of variance, P > 0.05).

