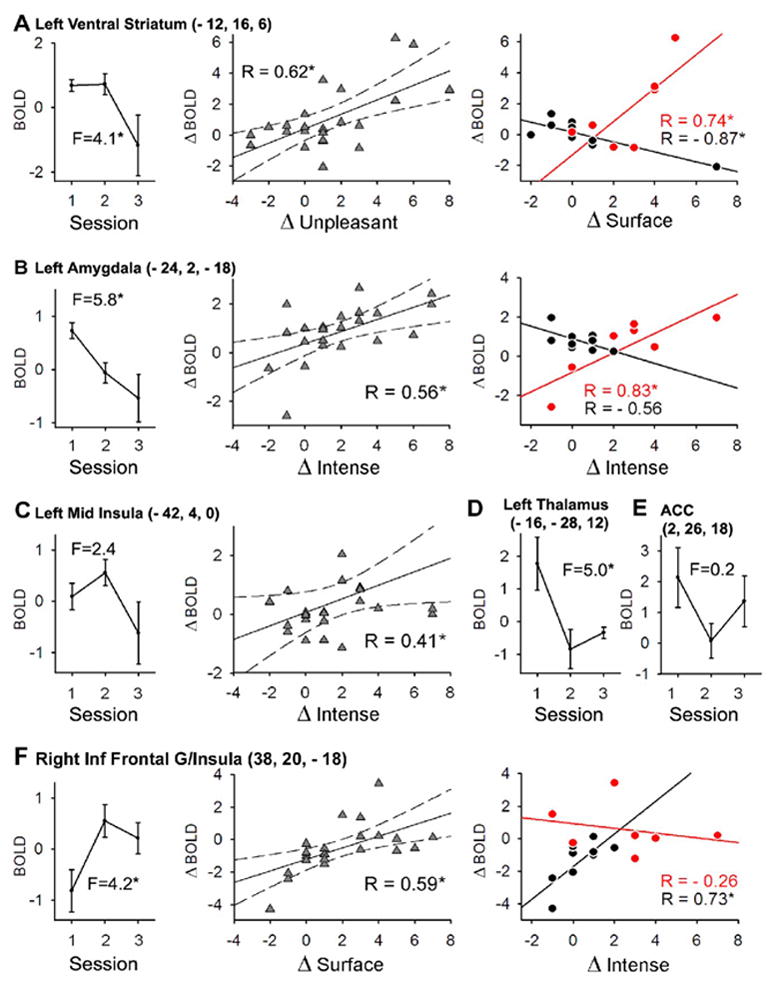
Figure 6. Characteristics of brain regional activity in relation to treatment response.

Six brain regions of interest extracted from either the treatment analysis (Figure 5) or from mean activity for spontaneous pain (Figure 4A) are shown in relation to treatment (one-way ANOVA across the three treatment sessions; n = 9 patients; all F-values have 2 and 22 d.f.; * = p < 0.05) and to various descriptors from the Neuropathic Pain Scale (see table 3) (A) Activity in striatum (circled as 1 in figure 5; LVS in Table 3) is significantly modulated by treatment. The change in activity across sessions (ΔBOLD) is significantly positively correlated with change in unpleasantness (ΔUnpleasant) between sessions (second panel). Last panel shows the correlation between ΔBOLD and ΔSurface (another NPS descriptor), between sessions 1 and 2 (acute treatment, black), and between sessions 2 and 3 (long-term treatment, red). The change in correlation coefficient is significant. (B) The same analysis as in A for amygdala (circled as 2 in figure 4A; L Amyg in Table 3). Note that the cluster did not reach significance in whole brain statistical analysis (Figure 5), but there is a significant effect of treatment. The ΔBOLD is significantly positively correlated with ΔIntense (second panel). This correlation is not significant after acute treatment (black; last panel), but changes significantly at session 3 after 2-weeks of treatment (red; last panel). (C) Left mid insula (circled as 3 in Figure 5; L Ins3 in Table 3) shows no overall treatment effect, but activity decreases most at session 3. The ΔBOLD is significantly correlated with ΔIntense, across sessions. (D) Treatment effect was also observed in left thalamus (circled 4 in Figure 5; L Tha in Table 3); there was no significant correlation however between across session activity change and NPS descriptors. (E) No overall treatment effect was observed in ACC (BA 24) (circled as 5 in Figure 4A; ACC3 in Table 3). However, both left thalamus and ACC do show a significant decrease in activity with acute treatment. (F) Activity in right anterior insula (indicated by number 6 on Fig.5; R insula/Inf Frontal G in Table 3) increases significantly with treatment, and ΔBOLD is significantly correlated to Δsurface. The correlation of ΔBOLD to ΔIntense shows an opposite pattern than that in ventral striatum and amygdala (last panels in A and B) after acute vs. long-term treatment (positive correlation for acute treatment, black, and negative correlation with long-term treatment, red). Correlations with significant r = *, p < 0.05.
