
Figure 6.
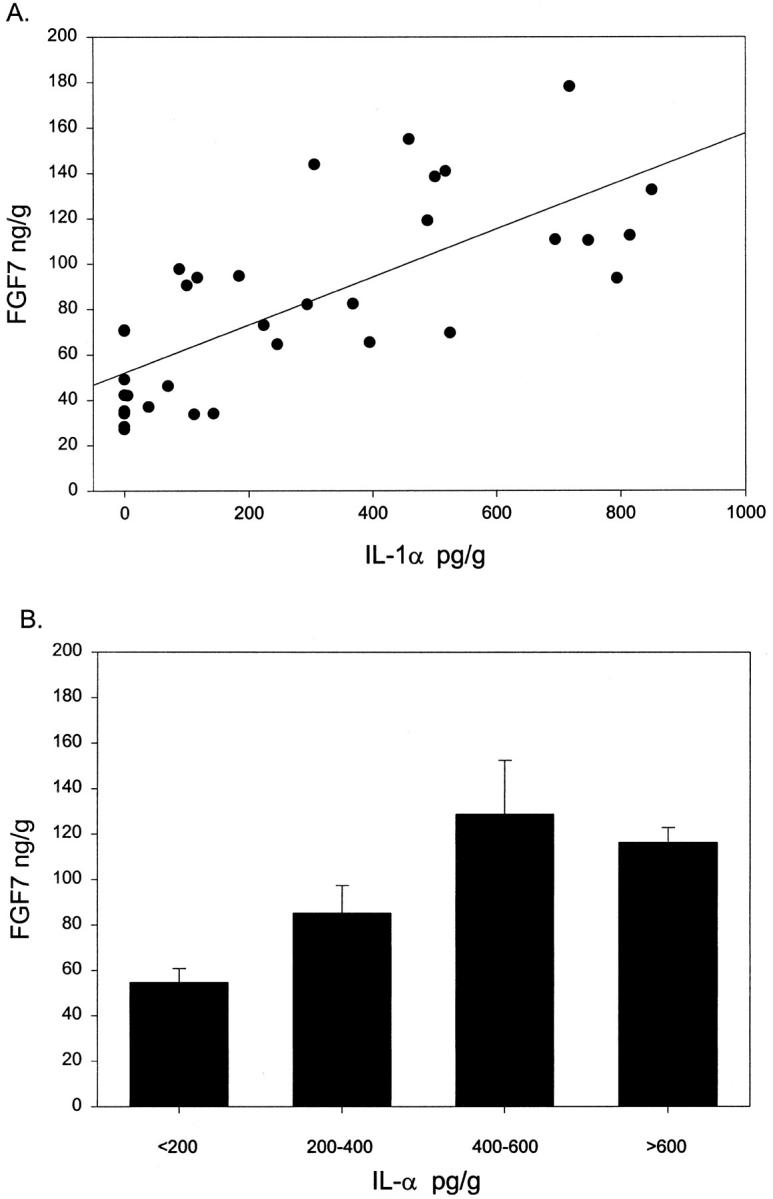
Correlation of tissue concentration of IL-1α and FGF7 in hyperplastic prostate. Proteins were extracted from snap-frozen BPH tissue samples, and the concentration of Il-1α and FGF7 was determined by ELISA in each extract. A: Scatter diagram with best fit linear regression shown (r = 0.73). B: Data are expressed as the mean FGF7 concentration (± SEM) for BPH tissue in four groups: <200 pg/ml (n = 17); 200–400 pg/ml (n = 6); 400–600 pg/ml (n = 5); and >600 pg/ml (n = 6).