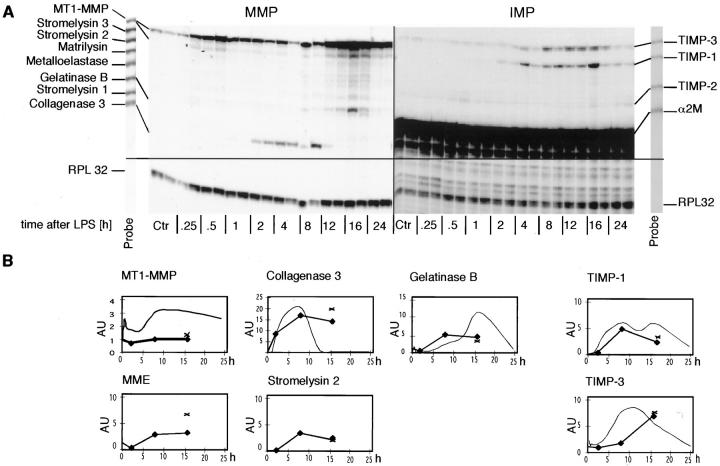
Figure 1.
Time course of MMP and TIMP gene expression in the liver after LPS injection. Mice were given a single i.p. injection of LPS (20 μg or 1 mg in 100 μl of PBS). Poly(A)+ RNA was isolated from the liver at the times shown and 1 μg used to determine MMP or TIMP mRNA levels by RPA as described in Materials and Methods. A: Time course of gene expression after injection of 20 μg of LPS. Autoradiograms showing the RPA-labeled probe sets used in this analysis are shown at the sides. The RPL 32 probe does not appear in the part of the RPA shown here. Note that the hybridized liver target mRNAs that lack the cloning site of the probe migrate at a lower molecular size. Two animals were used for each time point. The autoradiographic exposure times were 16 hours (MMP) and 6 hours (TIMP). B: Quantitative analysis of MMP and TIMP gene expression shown in A (20 μg LPS, fine curve) and after 1 mg of LPS (bold line, three mice were used at each time point, X MMP and TIMP gene expression in three mice that died at 15 to 18 hours after LPS). Charts are given for RNAs that are either induced or up-regulated more than twofold. For constitutively expressed RNAs that are up-regulated after LPS injection, here MT1-MMP and TIMP-3, the y axis label shows the fold up-regulation. For induced genes, the y axis label indicates arbitrary units.

