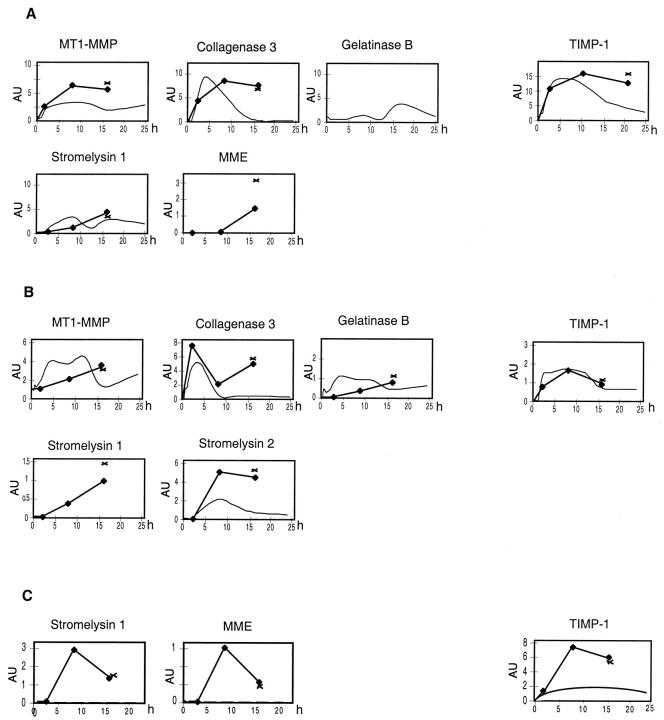
Figure 2.
Quantitative analysis of MMP and TIMP gene expression the organs of mice after injection of different doses of LPS (20 μg LPS, fine curve) and after 1 mg of LPS (bold line, three mice were used at each time point, X MMP and TIMP gene expression in three mice that died at 15 to 18 hours after LPS). A: MMP and TIMP gene expression in the spleen after different doses of LPS. B: Quantitative analysis of MMP and TIMP gene expression in the kidney after different doses of LPS. C: Quantitative analysis of MMP and TIMP gene expression in the brain after different doses of LPS. The RPAs and quantitative analysis was performed as described in Materials and Methods and the legend to Figure 1 ▶ .

