
Figure 3. A range of adult bone marrow progenitors representing various stages of differentiation expand under the influence of Delta 1.
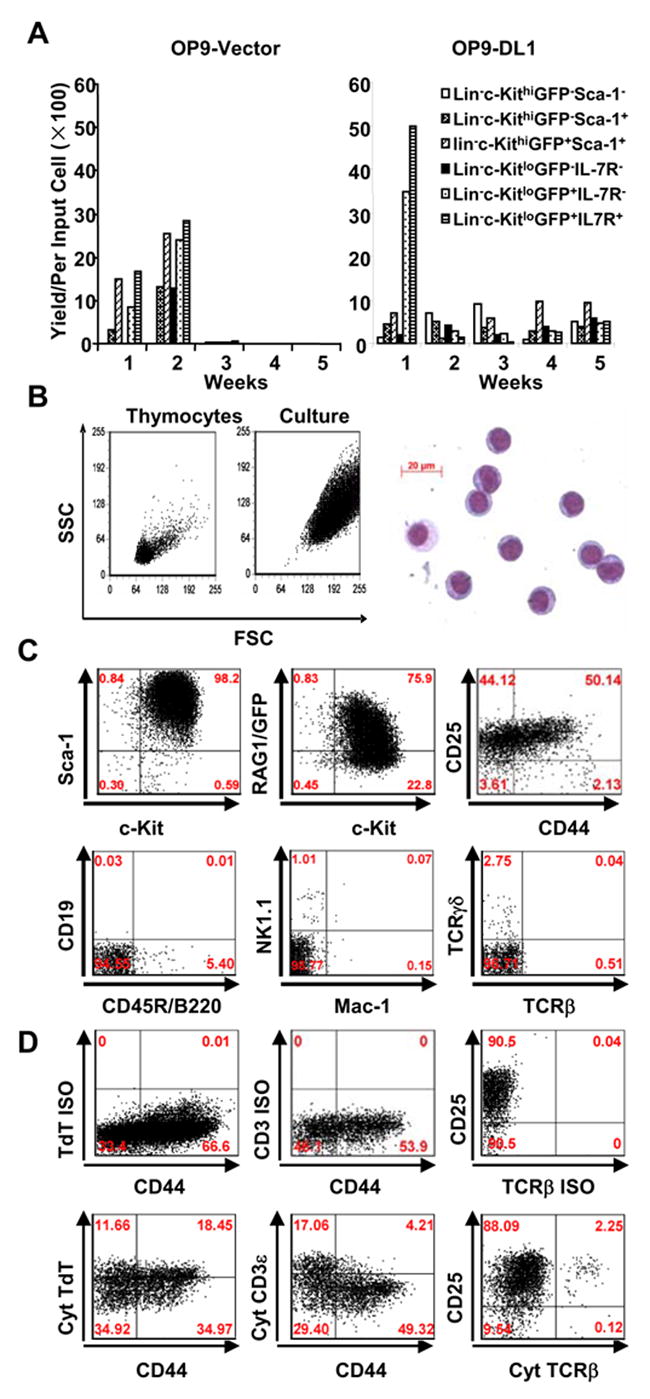
A. Six fractions of bone marrow progenitors were sorted on the basis of RAG1/GFP expression and cultured for 5 weeks on stromal cells plus 5 ng/ml IL-7 and 5 ng/ml of FL. The yields per input were calculated for each weekly expansion.
B. Light scatter properties of cultured cells are compared to freshly isolated lymphocytes (left panel). May-Grunwald-Giemsa staining of a cytocentrifuge preparation is also shown (right panel).
C. Representative flow cytometry results are shown for Lin− c-Kitlo IL-7Rα+ marrow cells expanded on OP9-DL1 for four weeks and then stained for progenitor and lineage specific markers. Identical results were obtained when eight other fractions of bone marrow were cultured in this way.
D. Expanded cells were first stained for surface lineage markers (VCAM-1 for stromal cells, DX-5 for NK cells, CD3ε for T cells, Mac-1 for myeloid cells), along with CD25 and CD44. They were then permeabilized and stained for cytoplasmic T lineage stage-specific proteins. Quadrants were set based on isotype matched controls (ISO) and positive controls using bone marrow and thymocytes (data not shown). Cultured cells were gated for VCAM-1− DX-5− CD3ε− Mac-1− cells, Isotype control stainings for cytoplasmic (cyt) TdT (Rabbit IgG and FITCGoat anti-rabbit IgG), cyt CD3ε (FITC IgG1), cyt TCRβ (PE IgG2) were also prepared with cultured cells and are shown in the upper panel. Cytoplasmic TdT, CD3ε and TCRβ are shown in the lower panel